RStudio Cheatsheets
RStudio Cheatsheets
The cheatsheets below make it easy to use some of our favorite packages. From time to time, we will add new cheatsheets. If you’d like us to drop you an email when we do, click the button below.
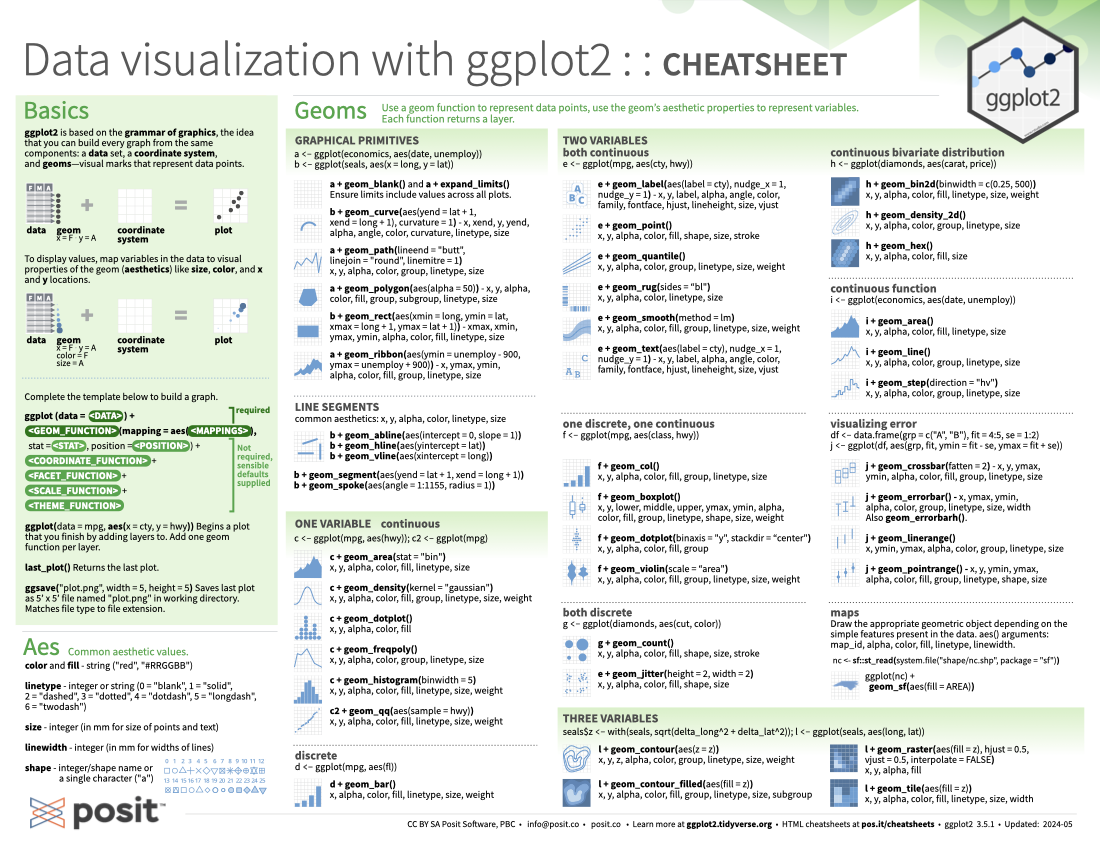
Subscribe to cheatsheet updatesData visualization with ggplot2 cheatsheet
The ggplot2 package lets you make beautiful and customizable plots of your data. It implements the grammar of graphics, an easy to use system for building plots. Updated August 2021.
Data transformation with dplyr cheatsheet
The dplyr package provides a grammar for manipulating tables in R. This cheatsheet will guide you through the grammar, reminding you how to select, filter, arrange, mutate, summarise, group, and join data frames and tibbles. Updated July 2021.
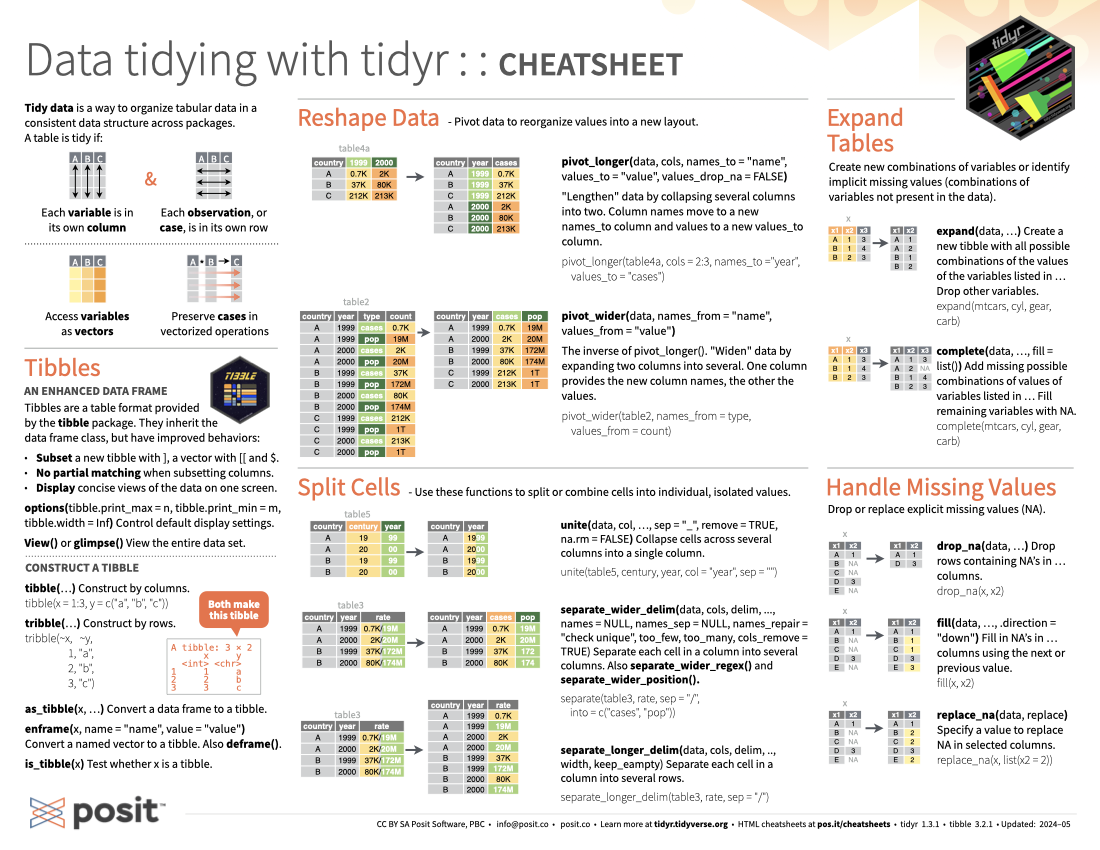
Data tidying with tidyr cheatsheet
The tidyr package provides a framework for creating and shaping tidy data, the data format that works the most seamlessly with R and the tidyverse. The front page of this cheatsheet provides an overview of tibbles and reshaping tidy data. The back page provides an overview of creating, reshaping, and transforming nested data and list-columns with tidyr, tibble, and dplyr. With list-columns, you can use a simple data frame to organize any collection of objects in R. Updated August 2021.
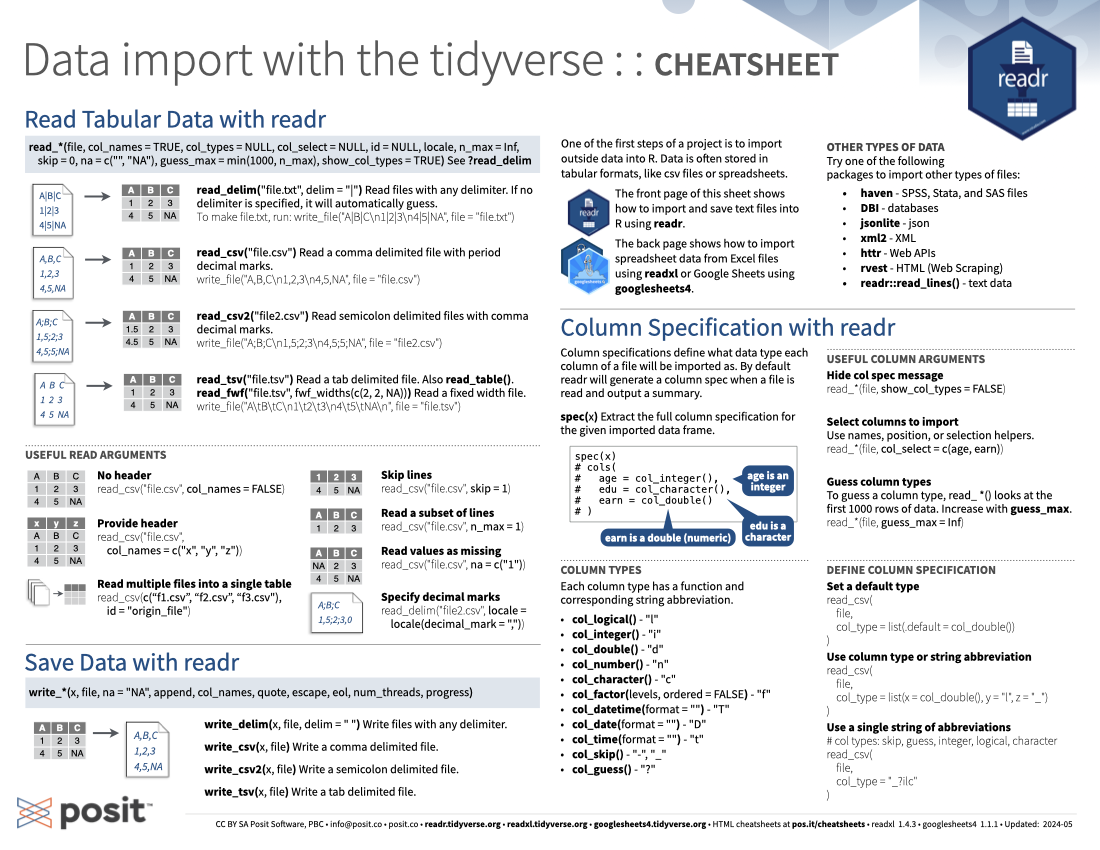
Data import with readr, readxl, and googlesheets4 cheatsheet
The tidyverse provides several packages for importing data into R and this cheatsheet covers three of them. On the front page: read and parse text files including csv, tsv, or fwf with readr. On the back page: read and write Excel spreadsheets with readxl and work with Google Sheets files with googlesheets4. Updated August 2021.
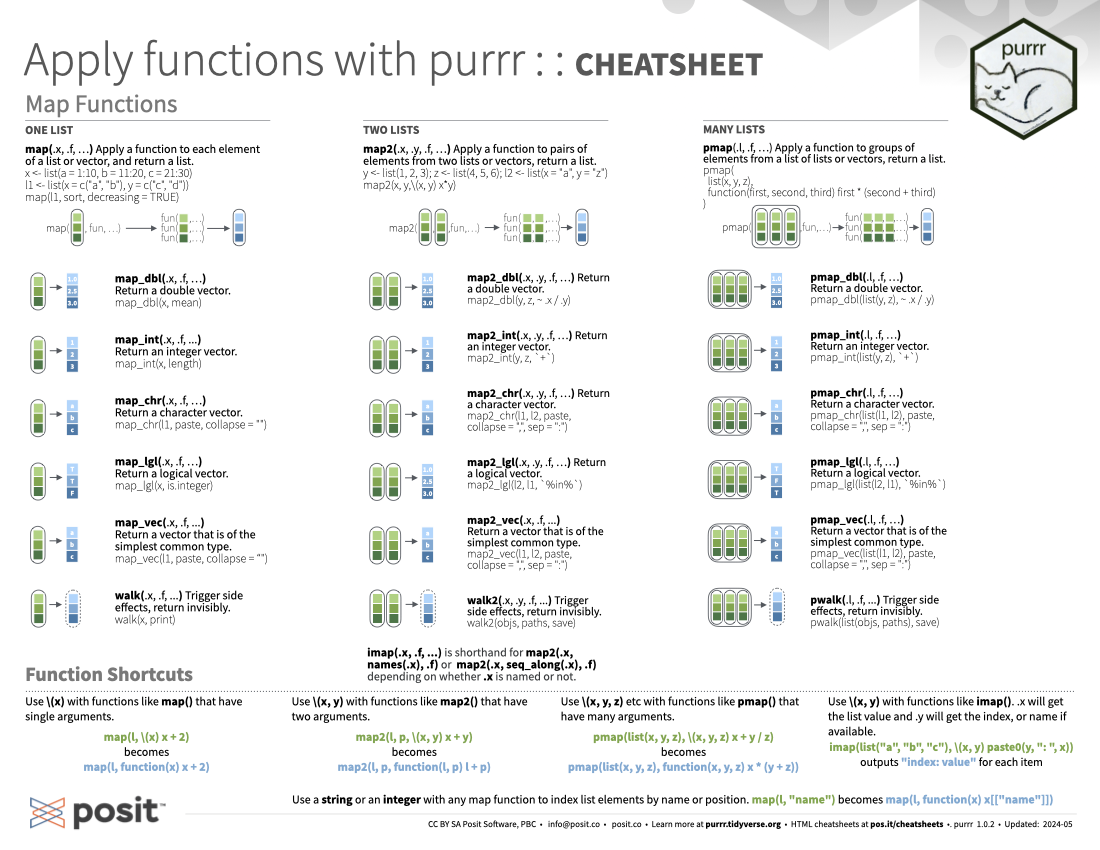
Apply functions with purrr cheatsheet
The purrr package makes it easy to work with lists and functions. This cheatsheet will remind you how to manipulate lists with purrr functions as well as how to apply functions iteratively to each element of a list or vector using map functions. Updated July 2021.
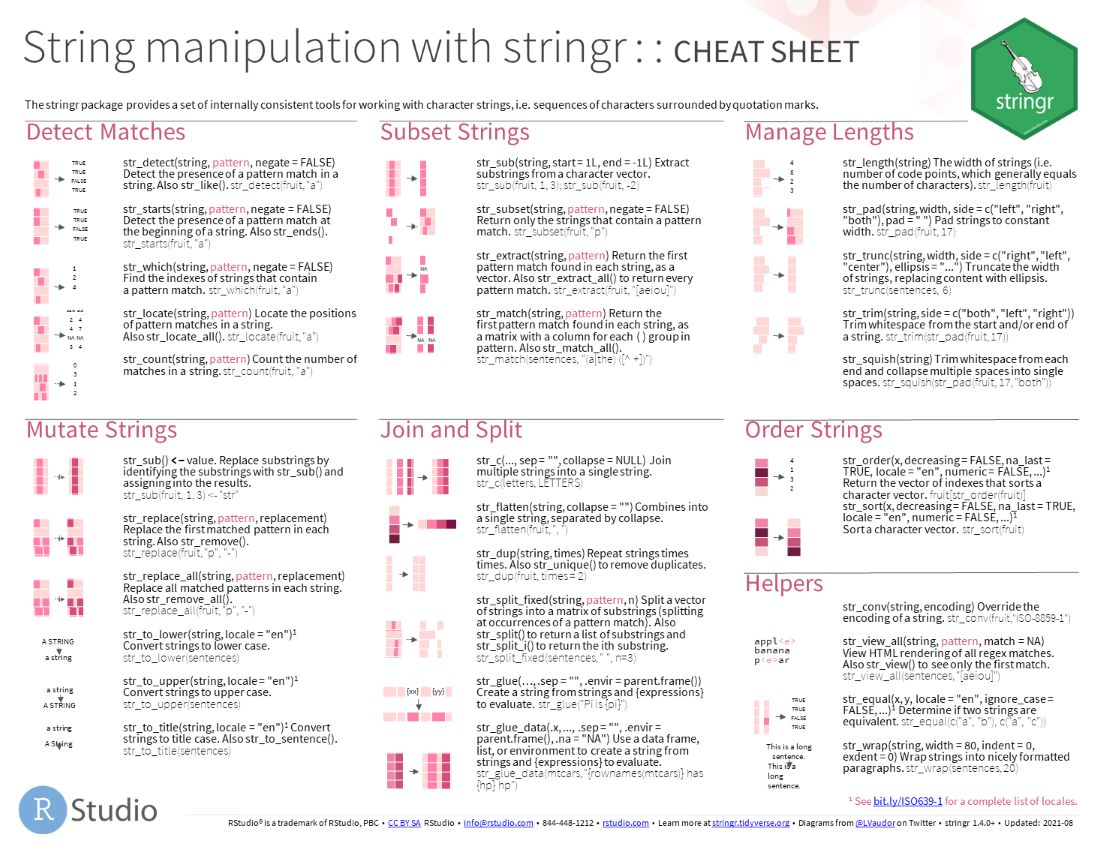
String manipulation with stringr cheatsheet
The stringr package provides an easy to use toolkit for working with strings, i.e. character data, in R. This cheatsheet guides you through stringr’s functions for manipulating strings. The back page provides a concise reference to regular expressions, a mini-language for describing, finding, and matching patterns in strings. Updated August 2021.
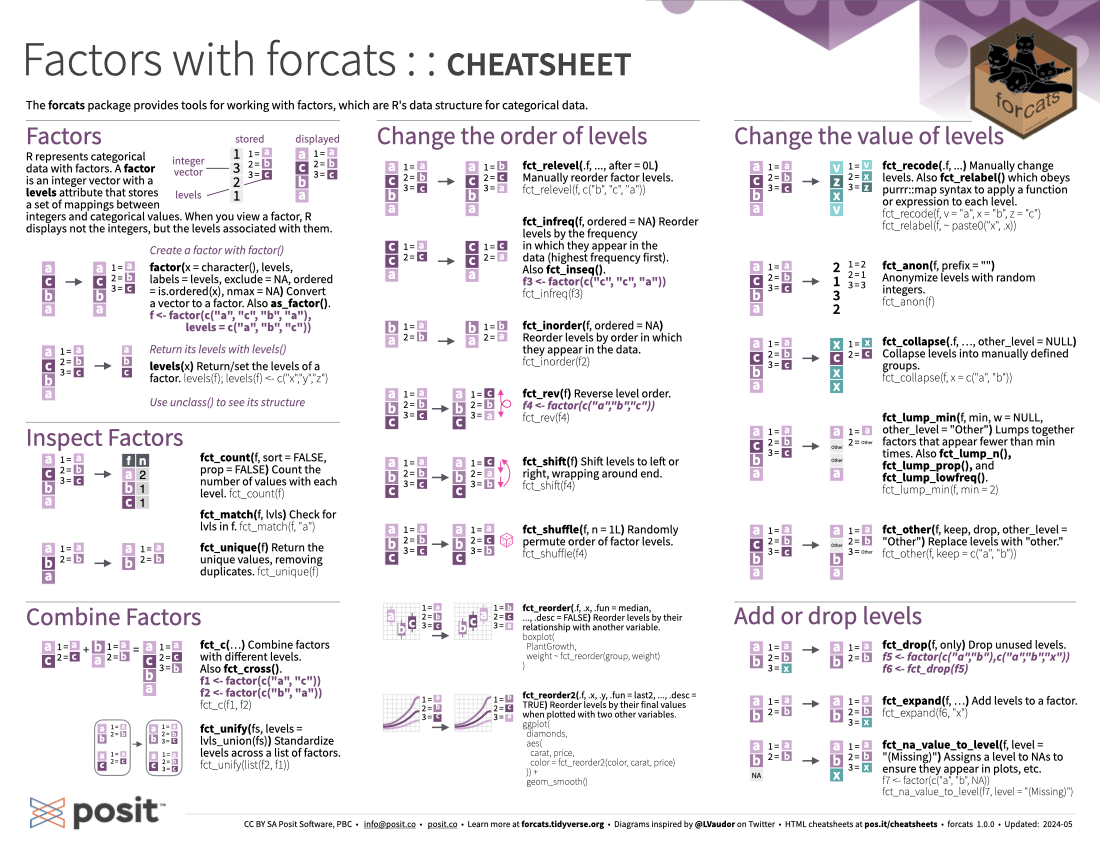
Factors with forcats cheatsheet
Factors are R’s data structure for categorical data. The forcats package makes it easy to work with factors. This cheatsheet reminds you how to make factors, reorder their levels, recode their values, and more. Updated July 2021.
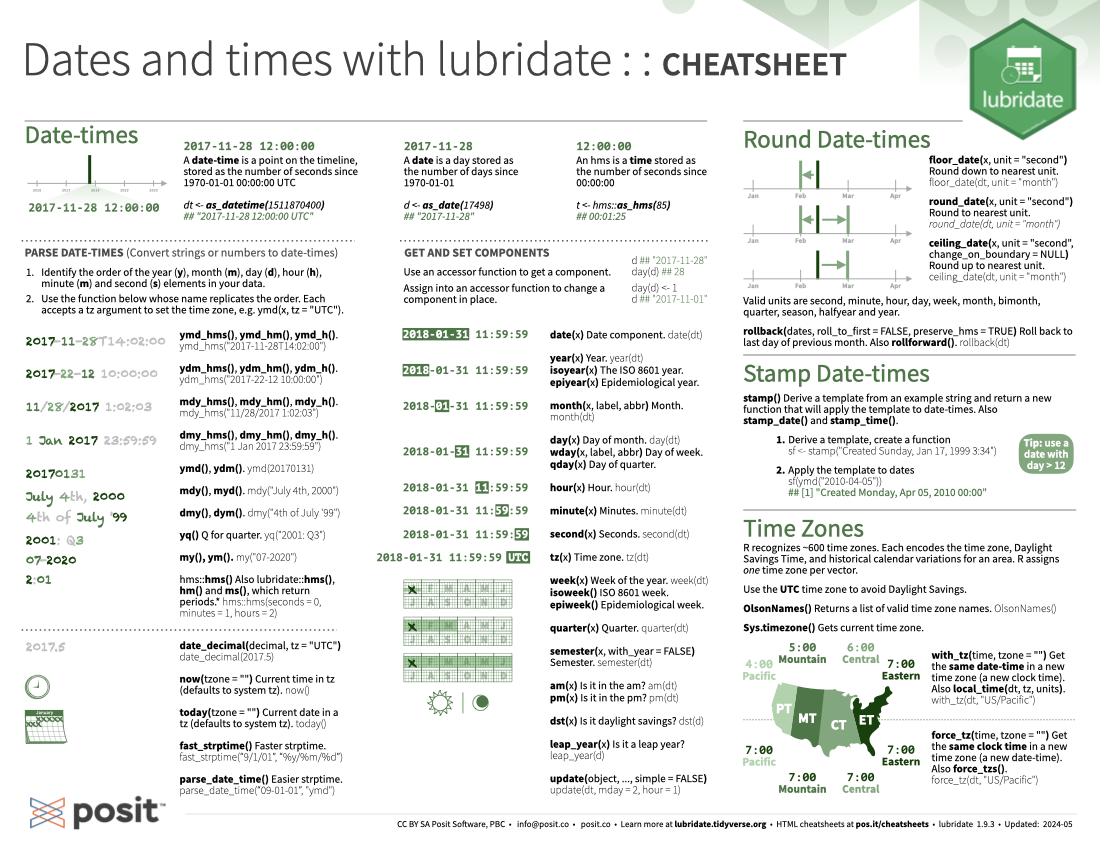
Dates and times with lubridate cheatsheet
The lubridate package makes it easier to work with dates and times in R. This cheatsheet covers how to round dates, work with time zones, extract elements of a date or time, parse dates into R and more. The back of the cheatsheet describes lubridate’s three timespan classes: periods, durations, and intervals; and explains how to do math with date-times. Updated July 2021.
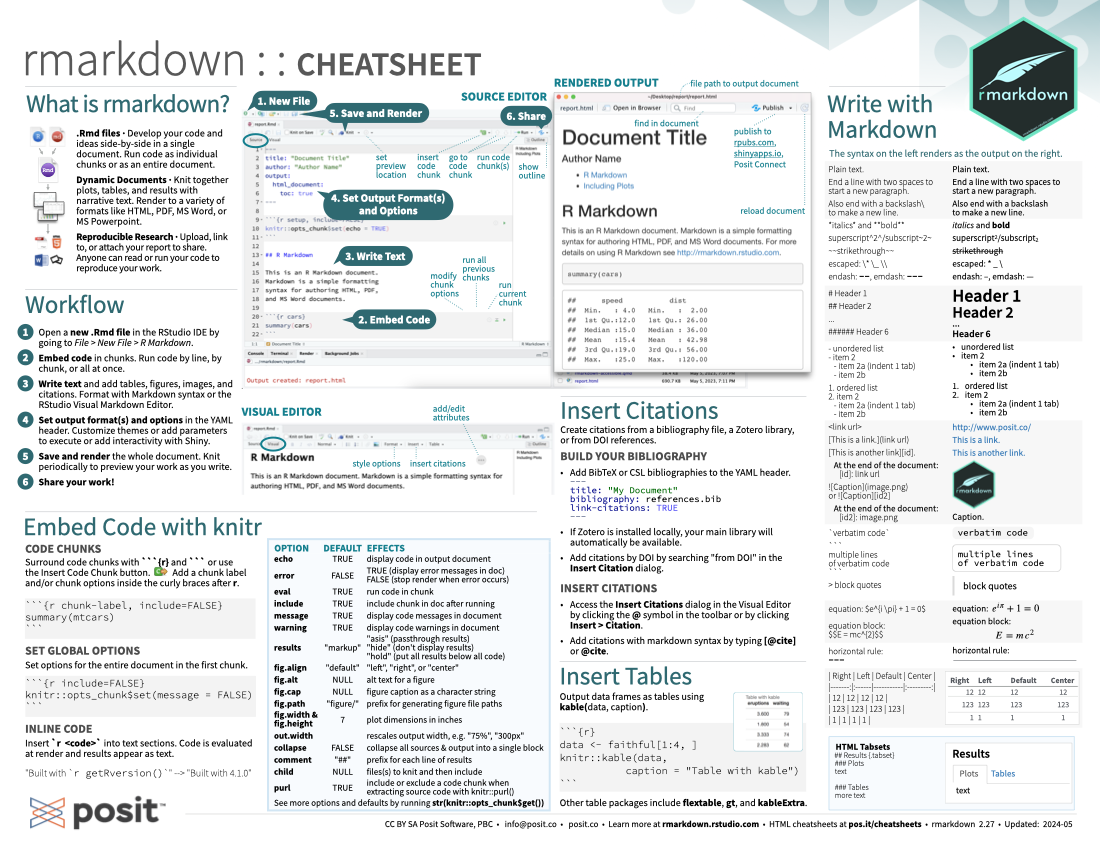
Dynamic documents with rmarkdown cheatsheet
R Markdown is an authoring format that makes it easy to write reproducible reports with R. You combine your R code with narration written in markdown (an easy-to-write plain text format) and then export the results as an HTML, PDF, or Word file. You can even use R Markdown to build interactive documents and slide decks. Updated August 2021.
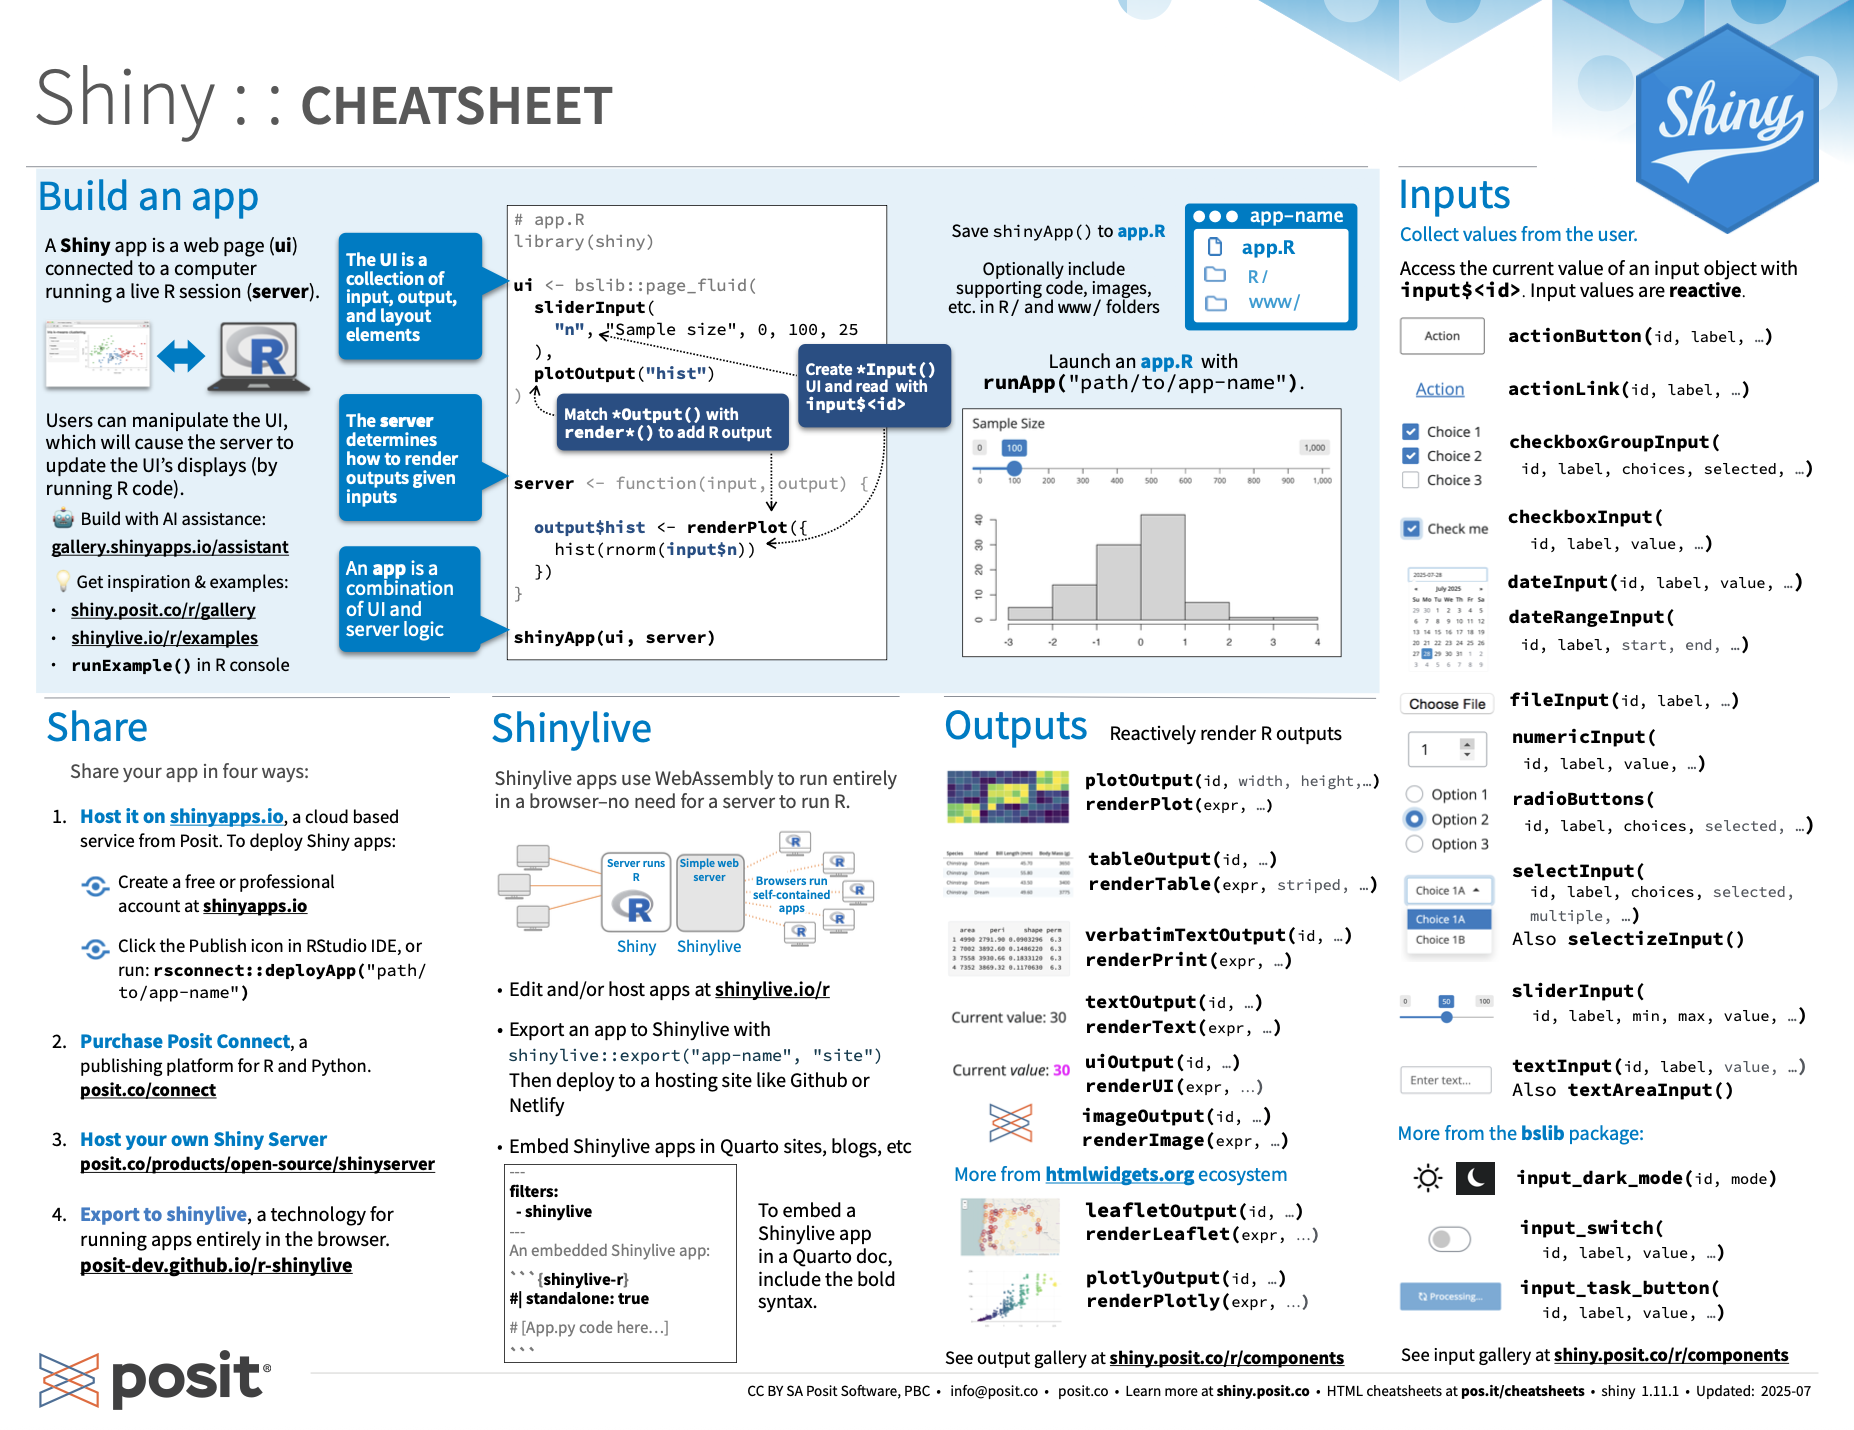
Interactive wep apps with shiny cheatsheet
If you’re ready to build interactive web apps with R, say hello to Shiny. This cheatsheet provides a tour of the shiny package and explains how to build and customize an interactive app. Be sure to follow the links on the sheet for even more information. Updated July 2021.
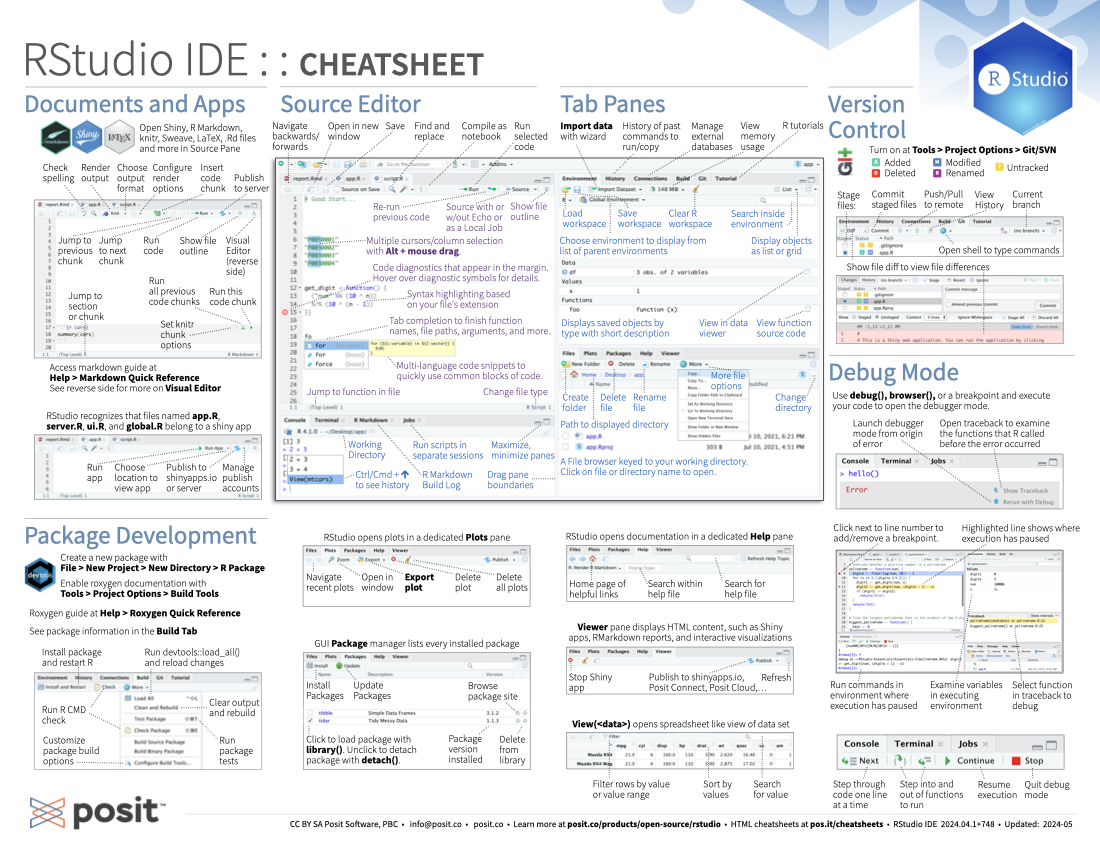
RStudio IDE cheatsheet
The RStudio IDE is the most popular integrated development environment for R. Do you want to write, run, and debug your own R code? Work collaboratively on R projects with version control? Build packages or create documents and apps? No matter what you do with R, the RStudio IDE can help you do it faster. This cheatsheet will guide you through the most useful features of the IDE, as well as the long list of keyboard shortcuts built into the RStudio IDE. Updated July 2021.
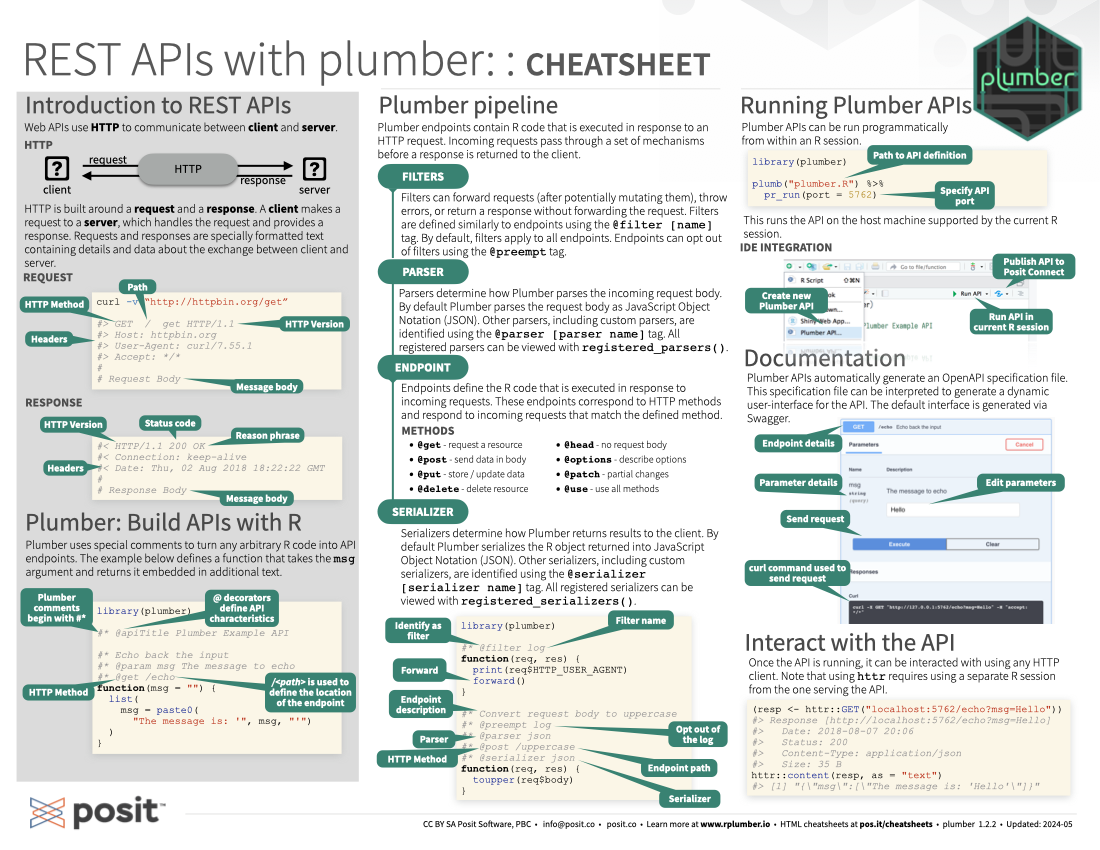
Web APIs for R with plumber cheatsheet
The plumber package enables R developers to build web APIs. Plumber uses special R comments combined with standard R functions to create API endpoints. This cheatsheet provides everything you need to get started building APIs in R with Plumber. Updated March 2021.
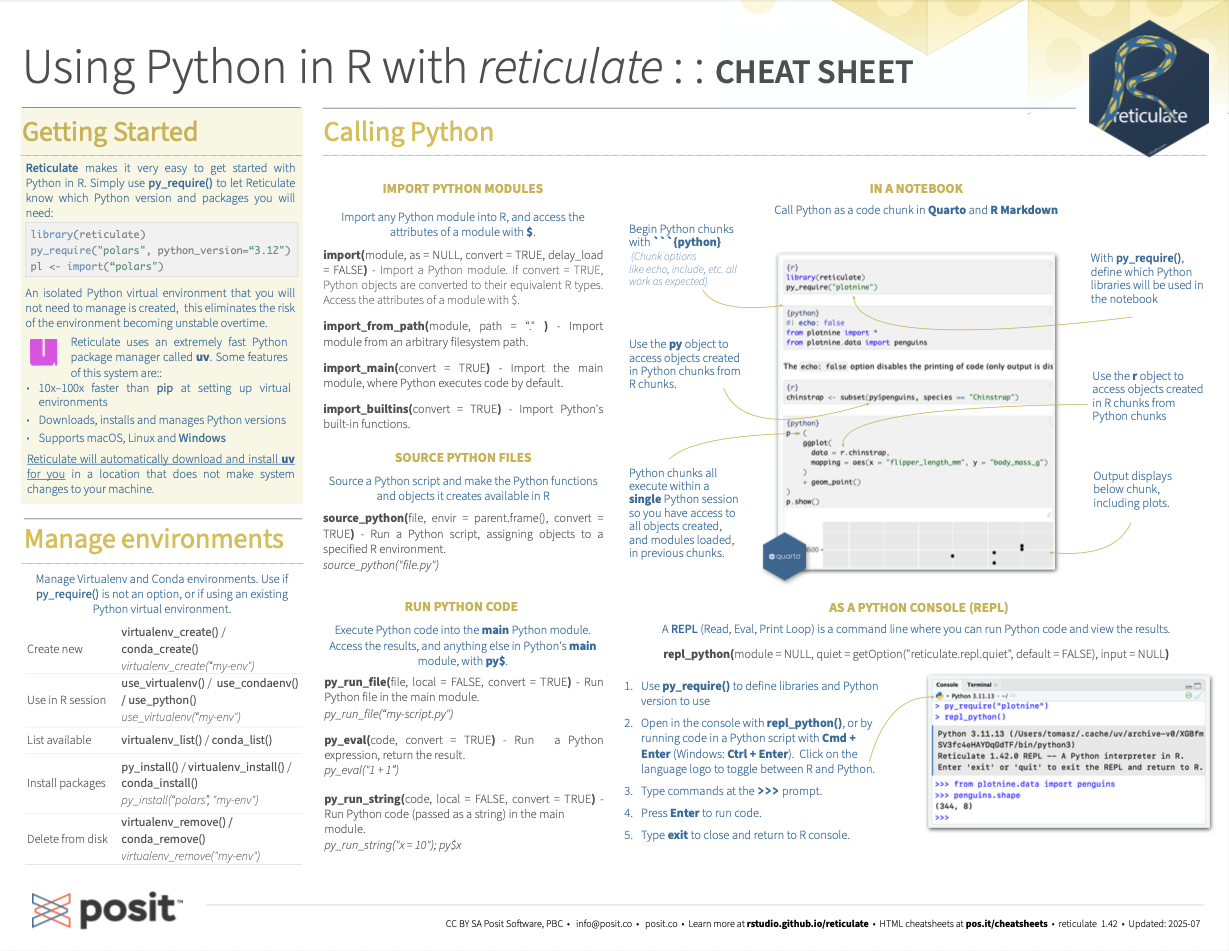
Python with R and reticulate cheatsheet
The reticulate package provides a comprehensive set of tools for interoperability between Python and R. With reticulate, you can call Python from R in a variety of ways including importing Python modules into R scripts, writing R Markdown Python chunks, sourcing Python scripts, and using Python interactively within the RStudio IDE. This cheatsheet will remind you how. Updated August 2021.
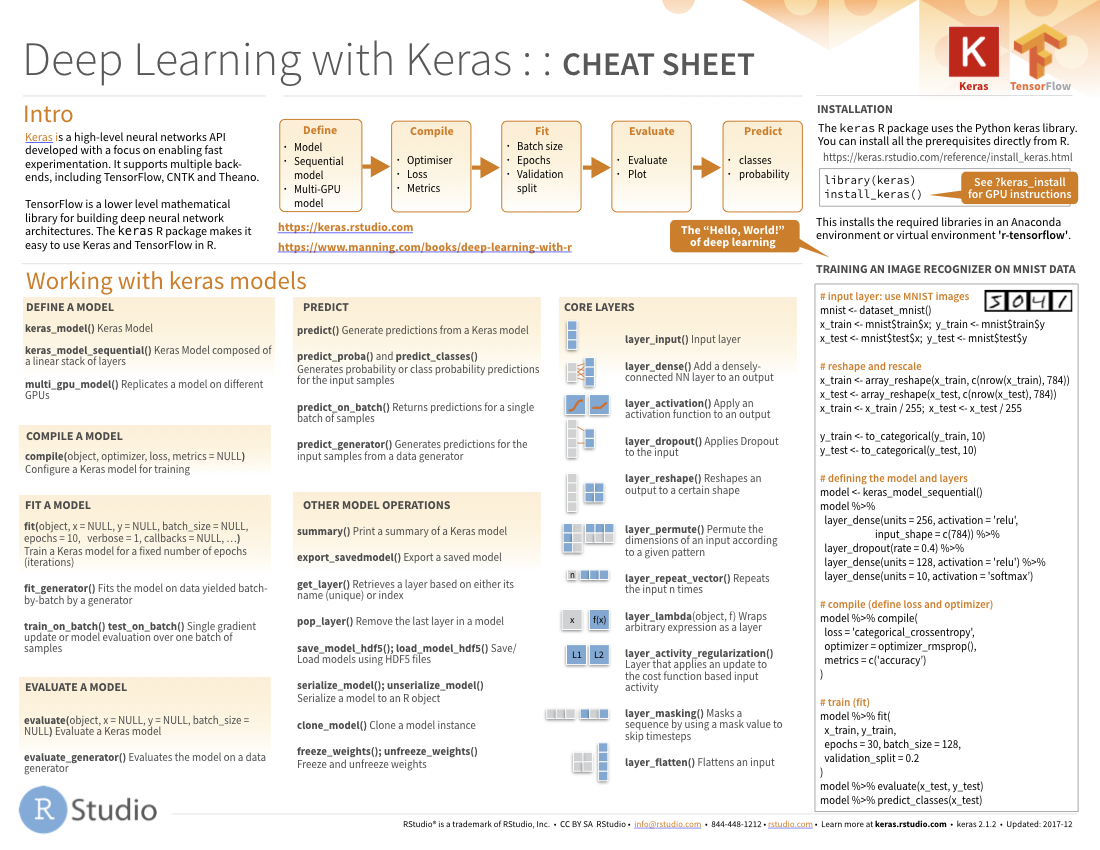
Deep learning with Keras cheatsheet
Keras is a high-level neural networks API developed with a focus on enabling fast experimentation. Keras supports both convolution based networks and recurrent networks (as well as combinations of the two), runs seamlessly on both CPU and GPU devices, and is capable of running on top of multiple back-ends including TensorFlow, CNTK, and Theano. Updated December 2017.
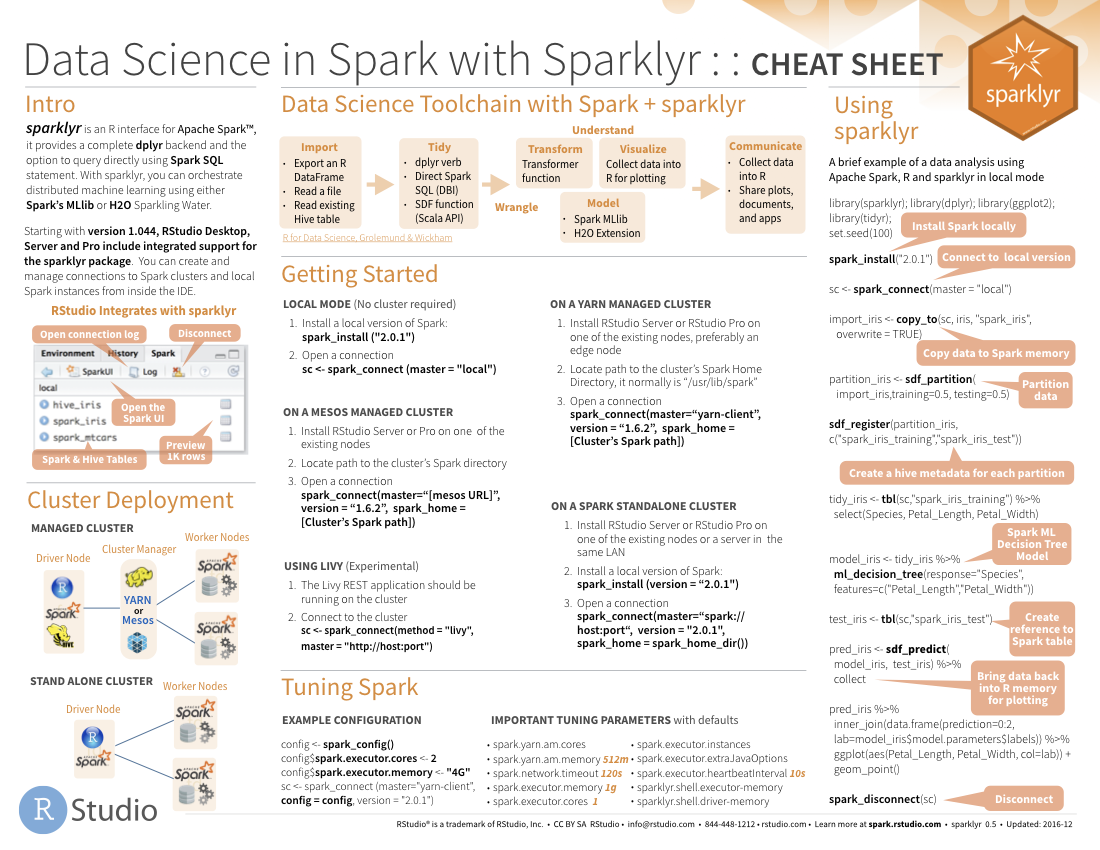
Data science in Spark with sparklyr cheatsheet
The sparklyr package provides an R interface to Apache Spark, a fast and general engine for processing Big Data. With sparklyr, you can connect to a local or remote Spark session, use dplyr to manipulate data in Spark, and run Spark’s built-in machine learning algorithms. Updated October 2019.
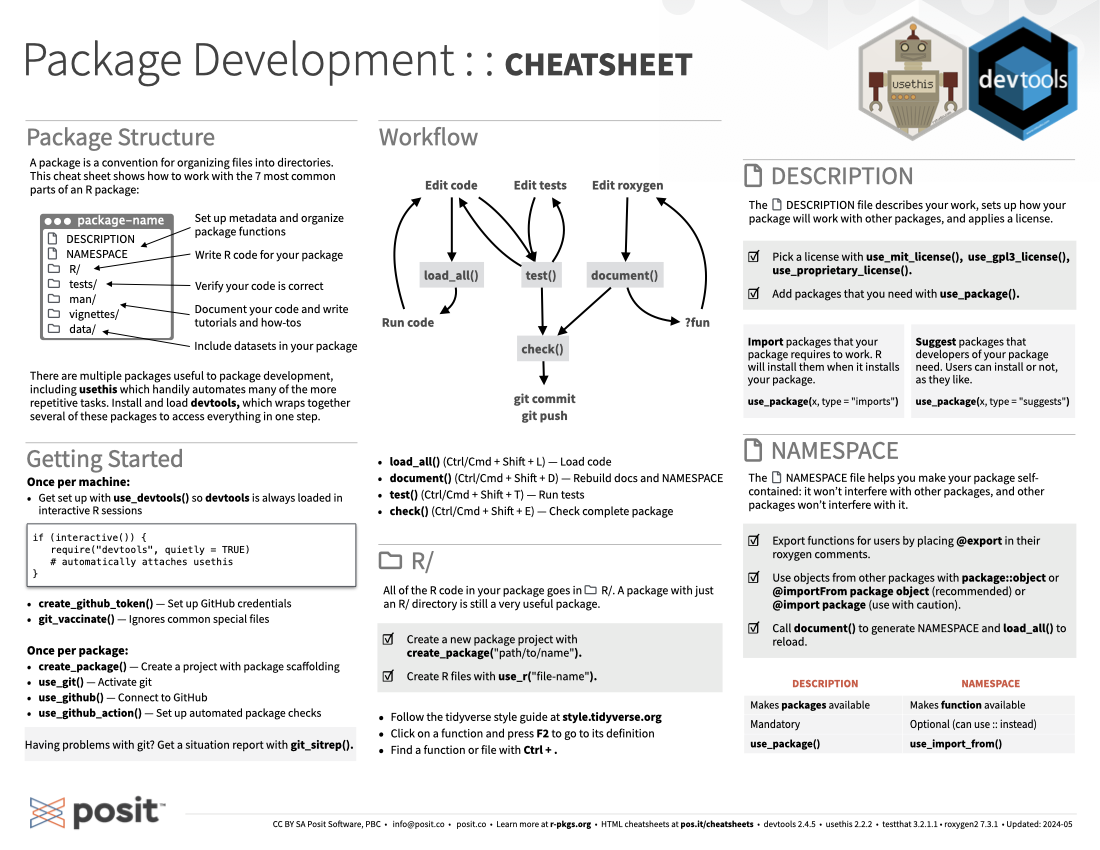
Package development with devtools cheatsheet
The devtools package makes it easy to build your own R packages, and packages make it easy to share your R code. Supplement this cheatsheet with r-pkgs.had.co.nz, Hadley’s book on package development. Updated January 2015.
Contributed Cheatsheets
These cheatsheets have been generously contributed by R users.
Advanced R
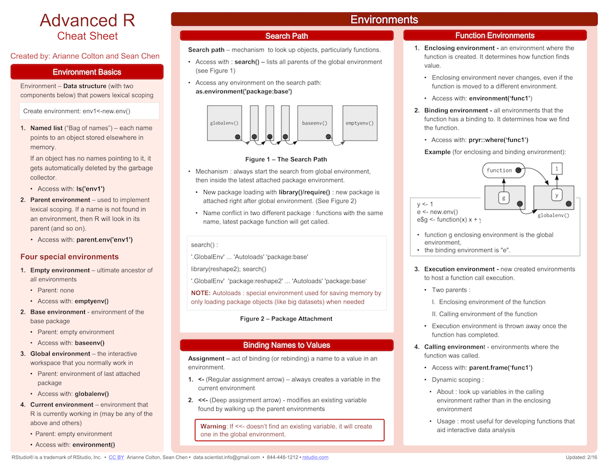 Environments, data structures, functions, subsetting and more, by Arianne Colton and Sean Chen. Updated February 2016.
Base R
 Vectors, matrices, lists, data frames, functions and more in base R, by Mhairi McNeill. Updated March 2015.
caret
![]() Modeling and machine learning in R with the caret package, by Max Kuhn. Updated September 2017.
Modeling and machine learning in R with the caret package, by Max Kuhn. Updated September 2017.
collapse
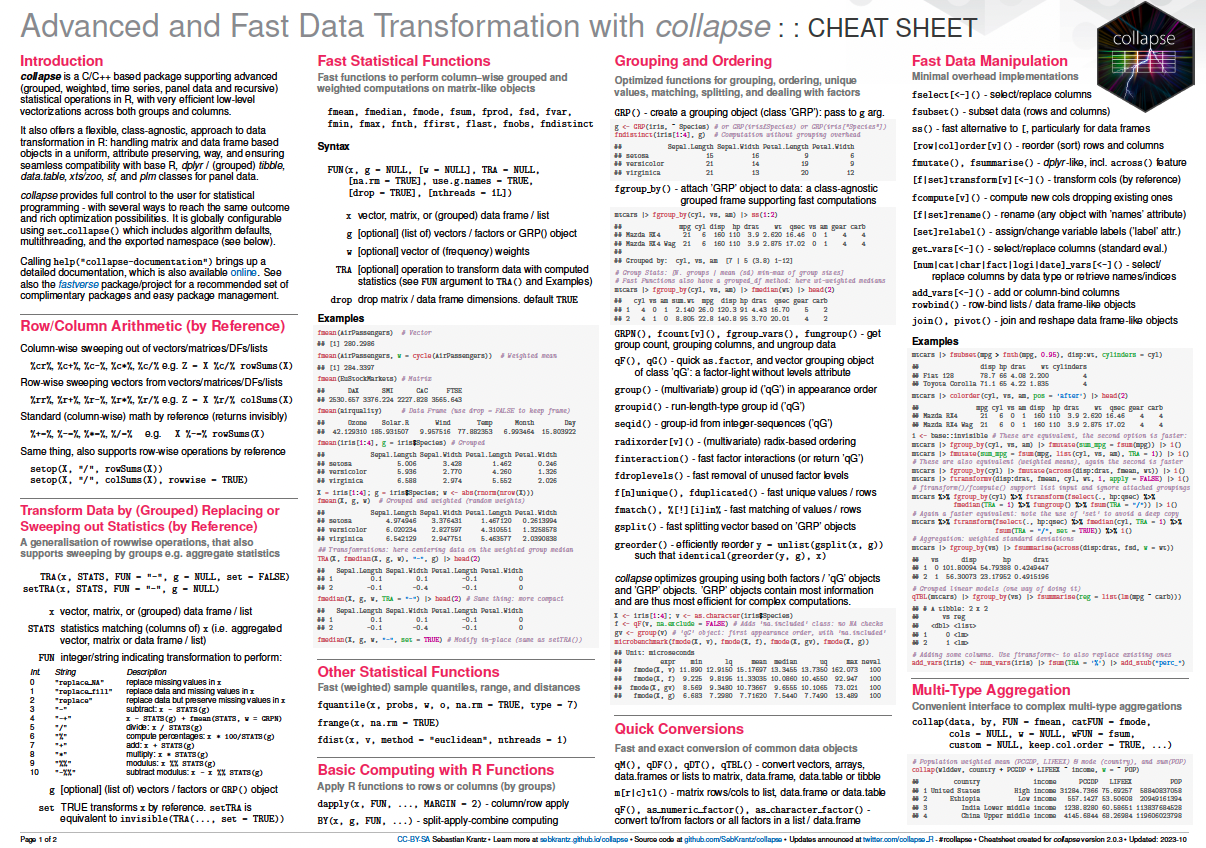 Advanced and fast data transformation with R, by Sebastian Krantz. Updated July 2021.
DeclareDesign
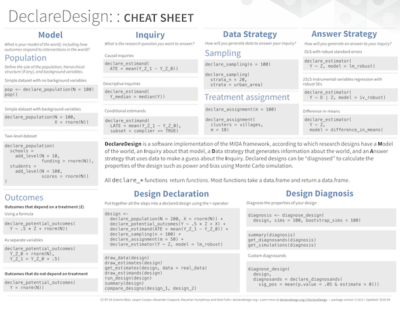 Tools to test research designs that use a MIDA framework. Updated April 2019.
distr6
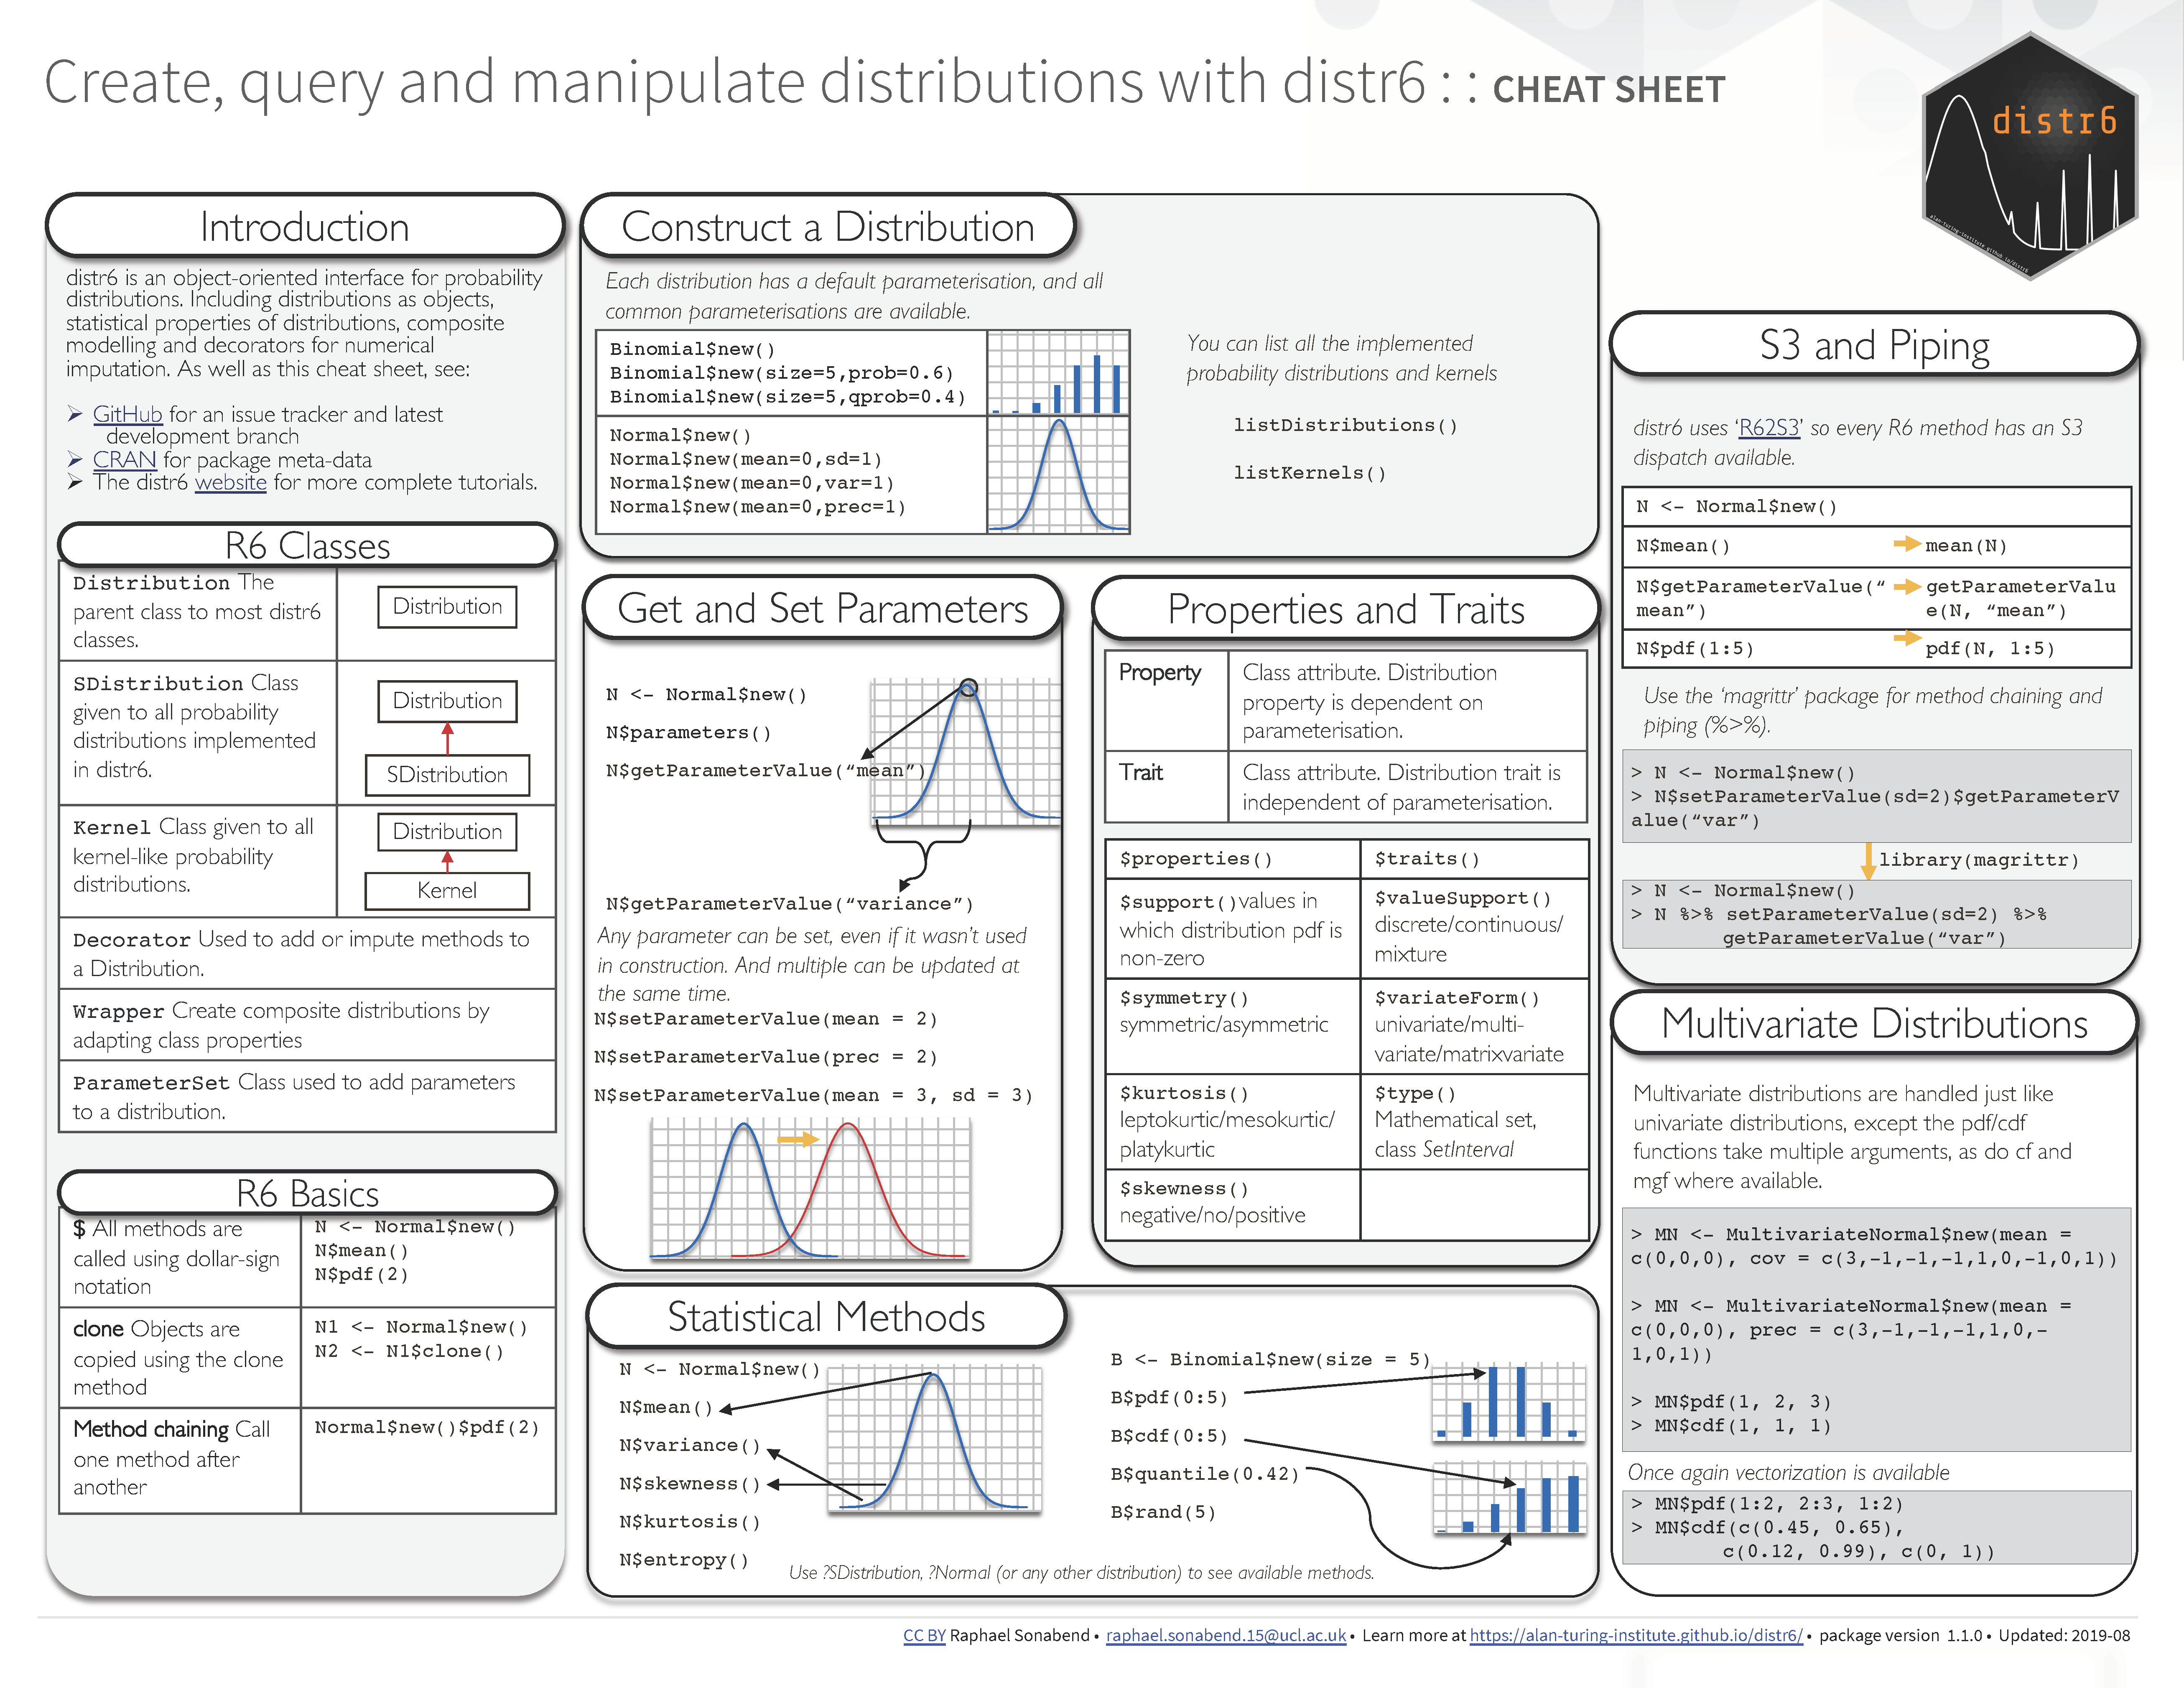 An object-oriented interface for probability distributions, by Raphael Sonabend. Updated August 2019.
gganimate
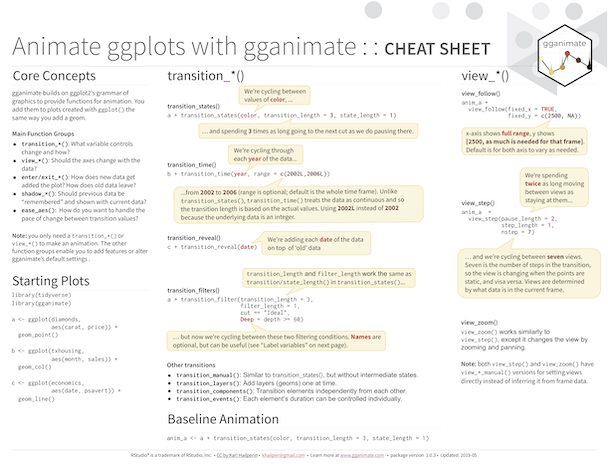 Extend ggplot2’s grammar of graphics with functions for animation, by Karl Hailperin. Updated May 2019.
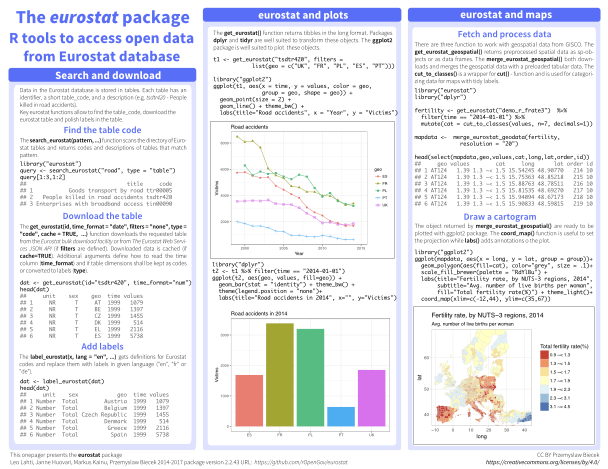
gwasrapidd
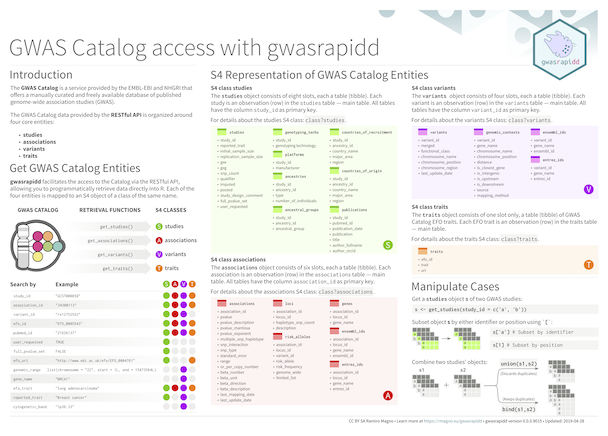 Provides programmatic access to the NHGRI-EBI Catalog of published genome-wide association studies, by Ramiro Magno. Updated April 2019.
h2o
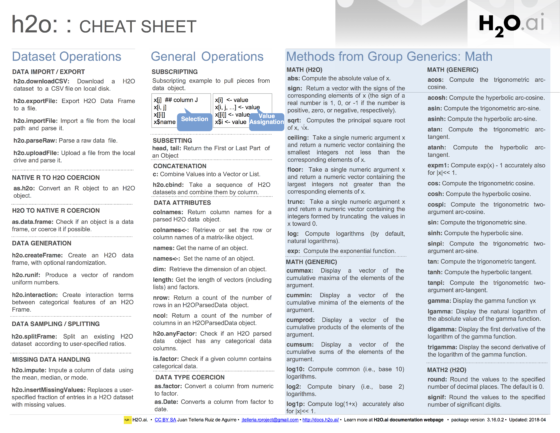 The R interface to h20’s algorithms for big data and parallel computing, by Juan Telleria. Updated June 2018.
jfa
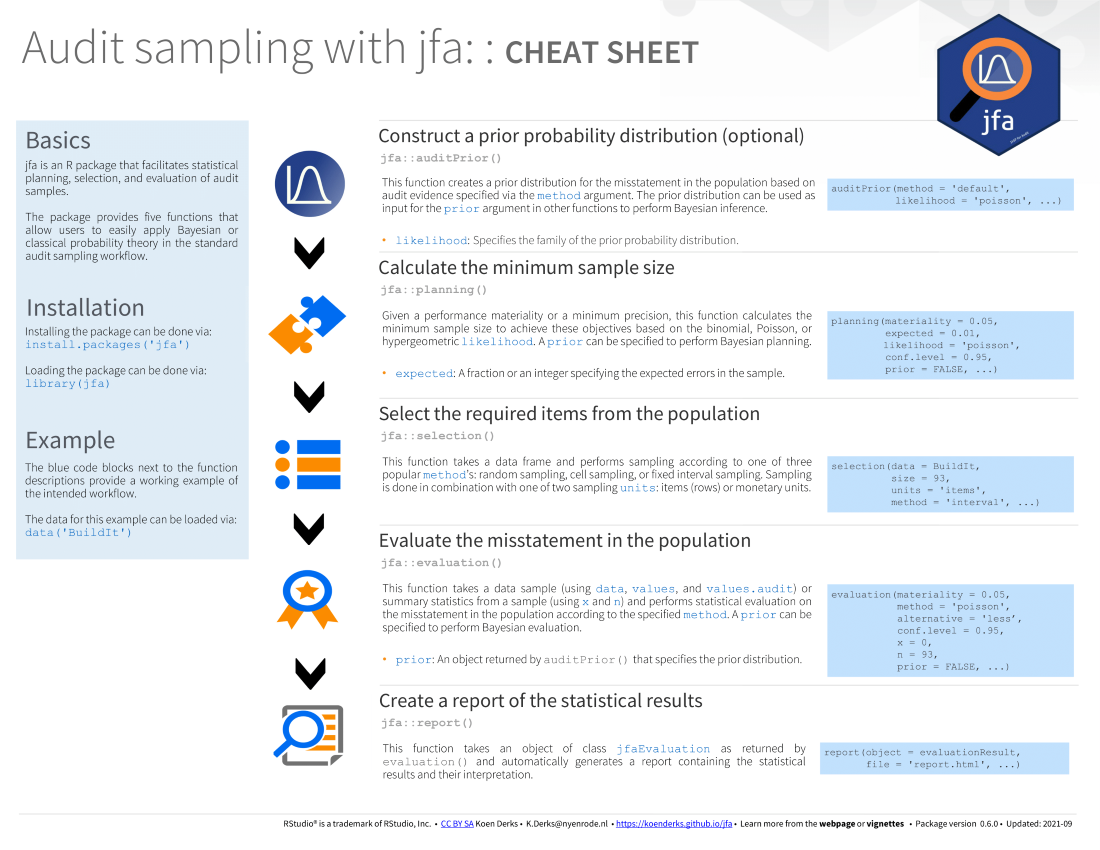 Work with bayesian and classical statistical audit samples, by Koen Derks. Updated July 2021.
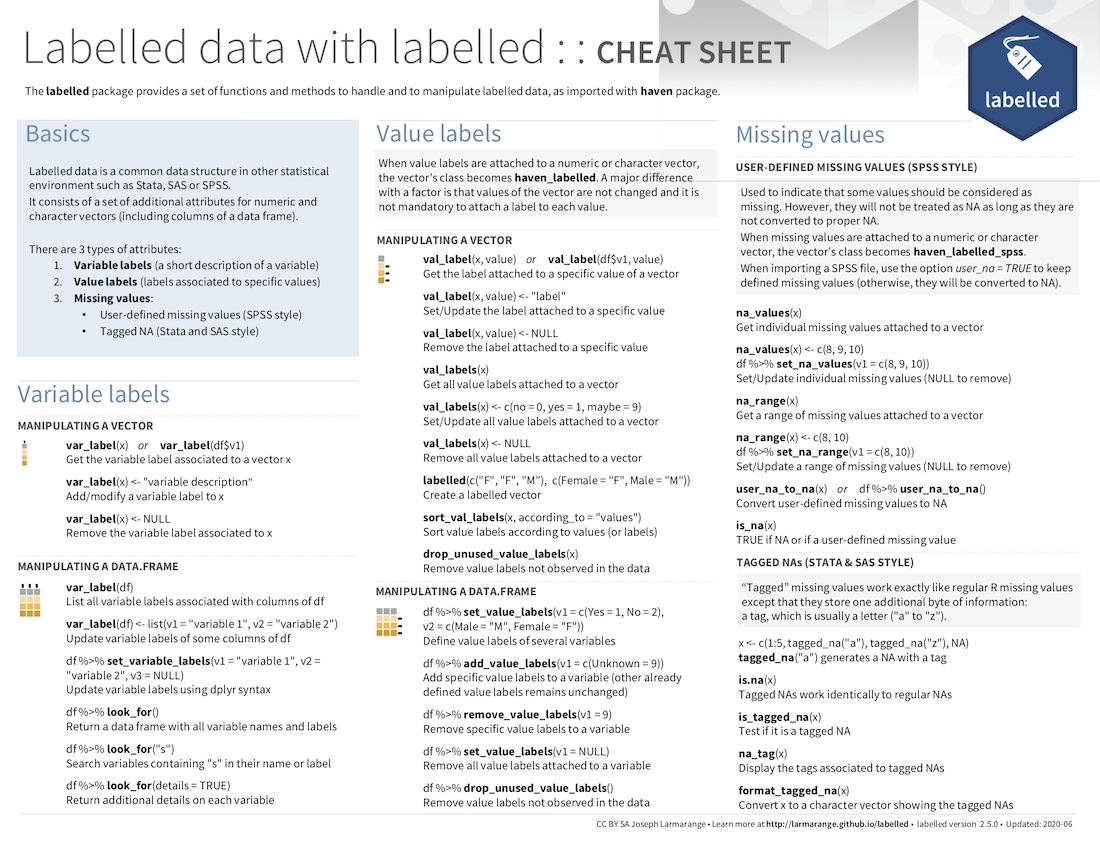
LaTeX
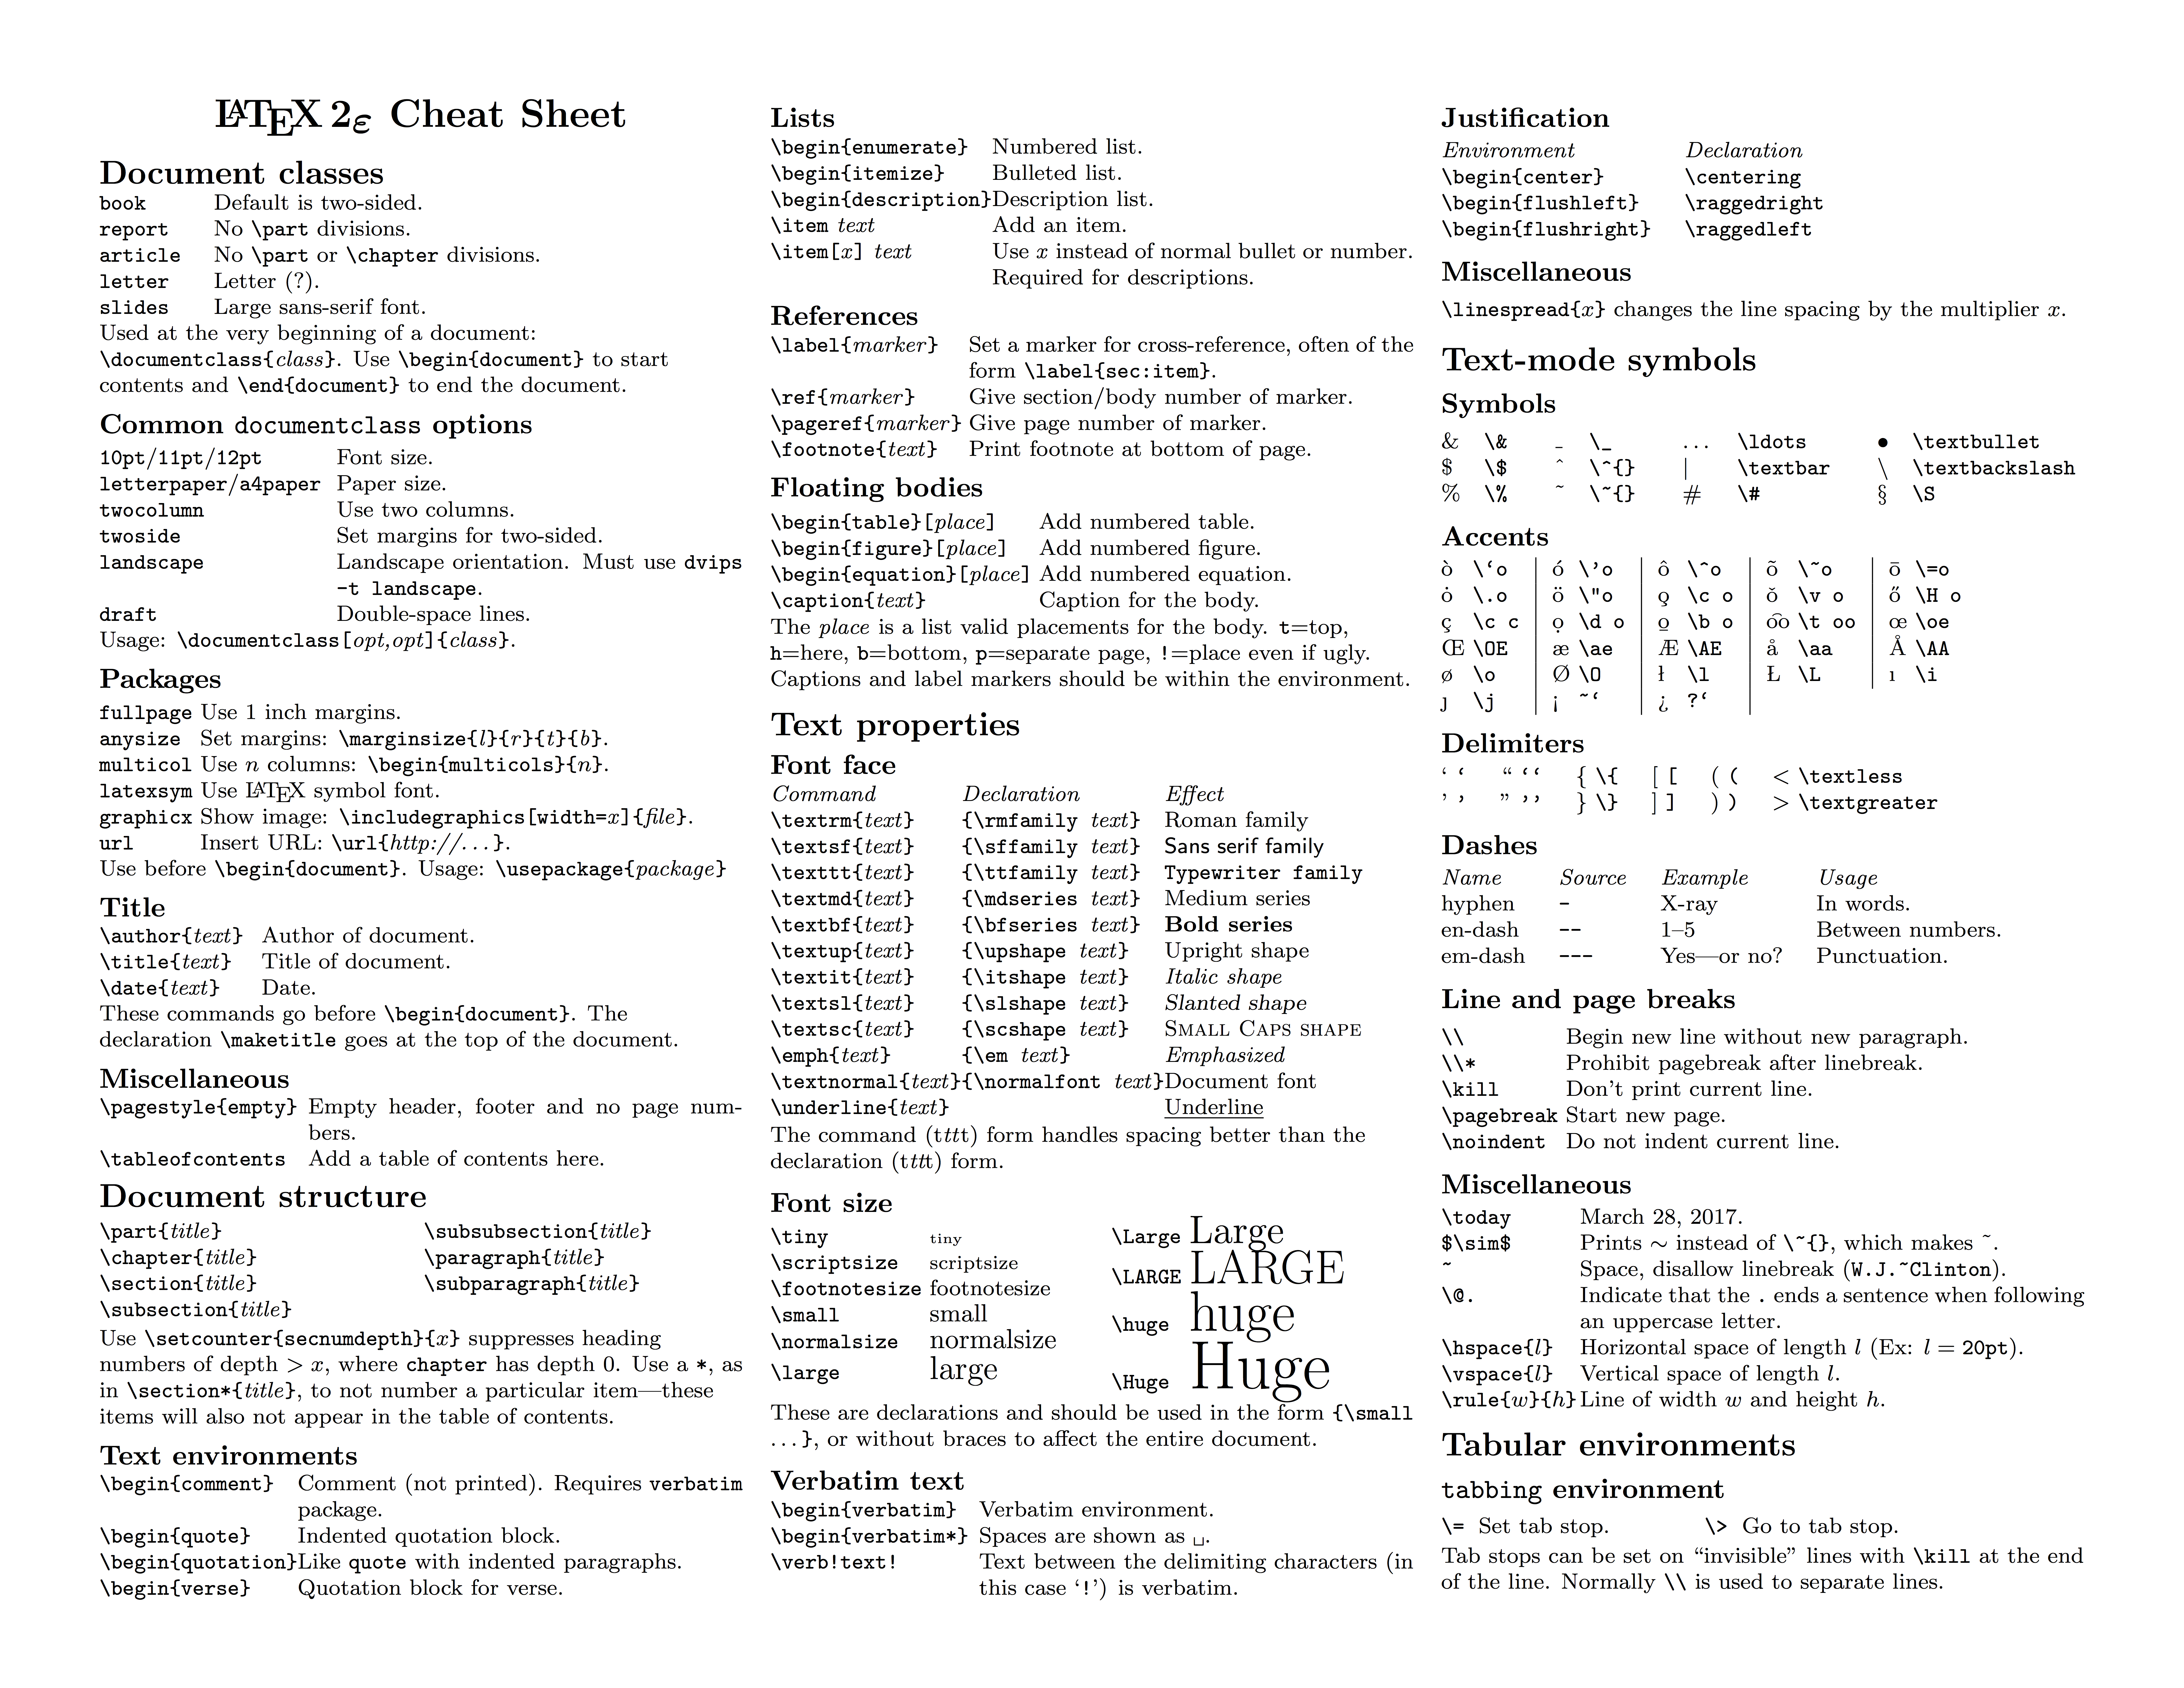 A reference to the LaTeX typesetting language, useful in combination with knitr and R Markdown, by Winston Chang. Updated January 2018.
Machine Learning Modelling
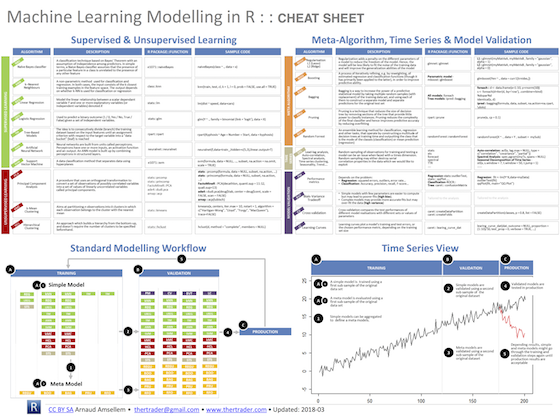 A tabular guide to machine learning algorithms in R, by Arnaud Amsellem. Updated March 2018.
mlr
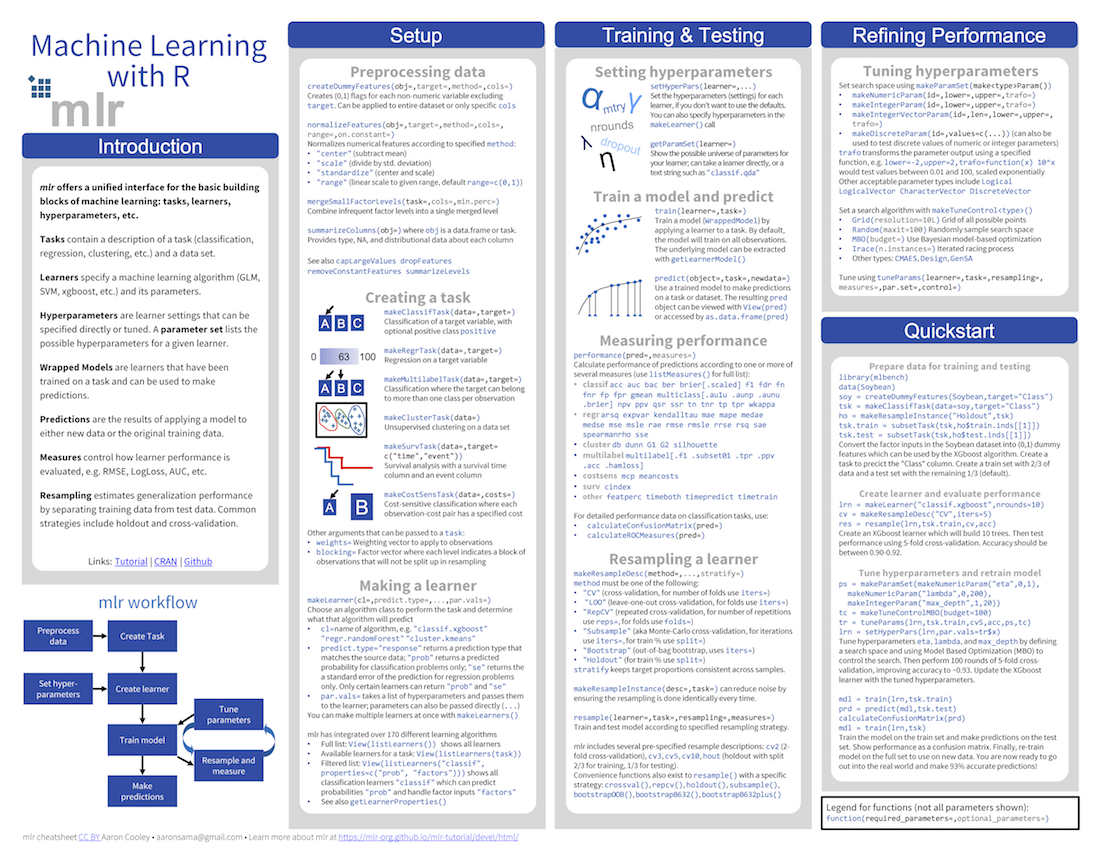 The mlr package offers a unified interface to R’s machine learning capabilities, by Aaron Cooley. Updated February 2018.
mosaic
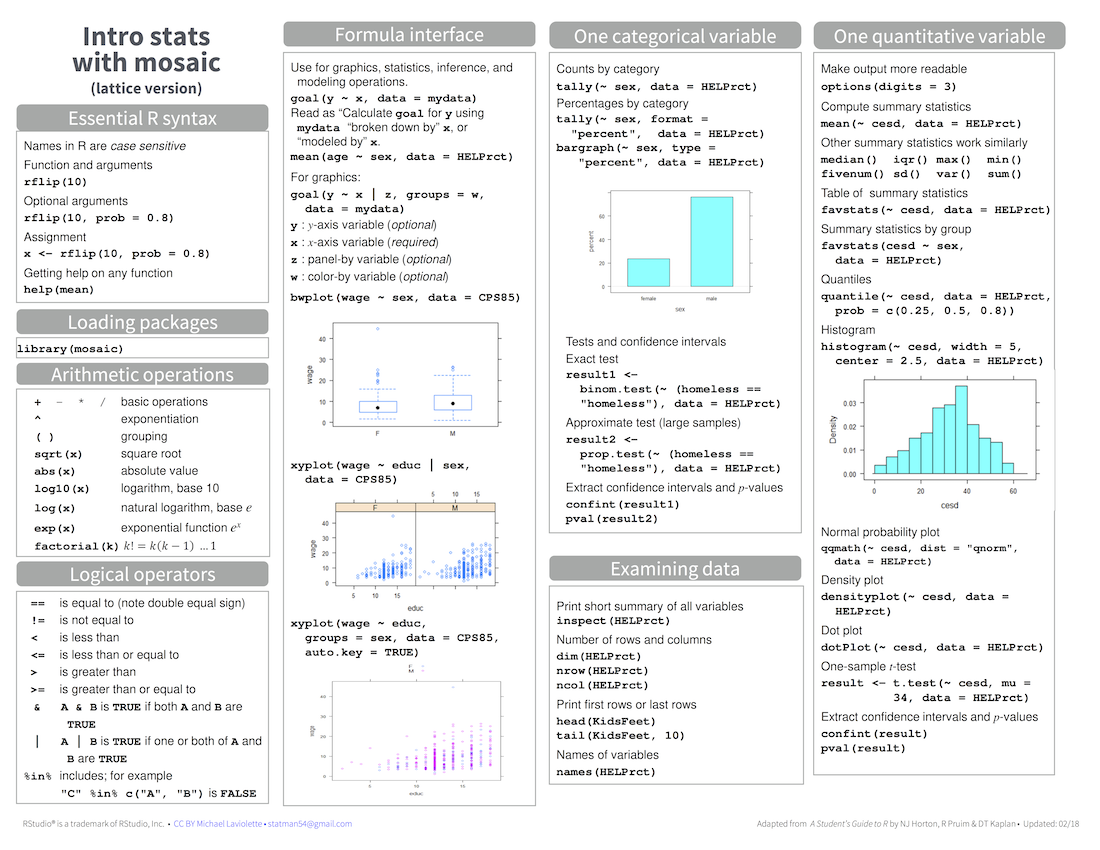 The mosaic package is for teaching mathematics, statistics, computation and modeling, by Michael Laviolette. Updated June 2020.
nardl
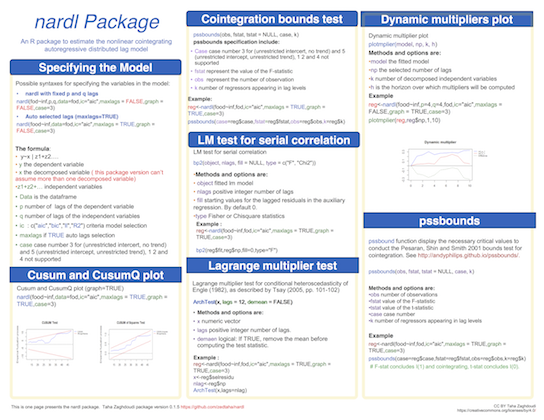 The nardl package estimates the nonlinear cointegrating autoregressive distributed lag model, by Taha Zaghdoudi. Updated October 2018.
nimble
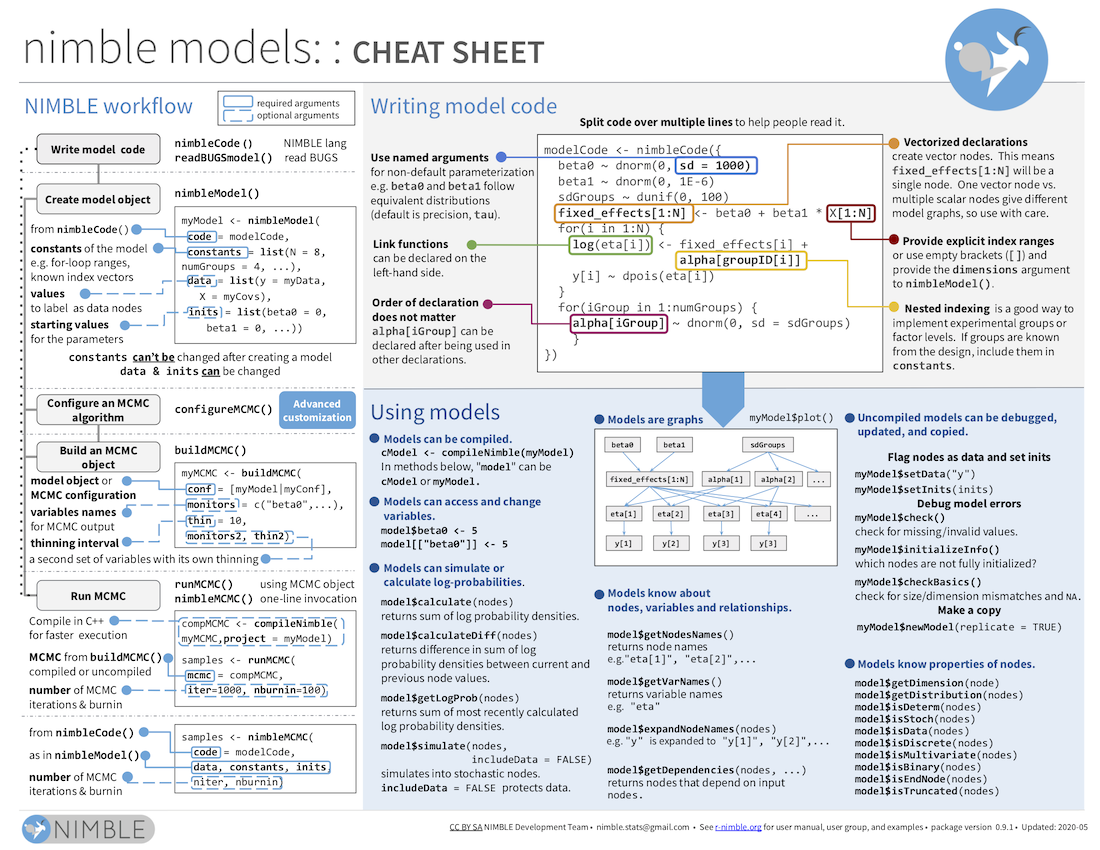 Hierarchical statistical models that extend BUGS and JAGS, by the Nimble development team. Updated May 2020.

overvieweR
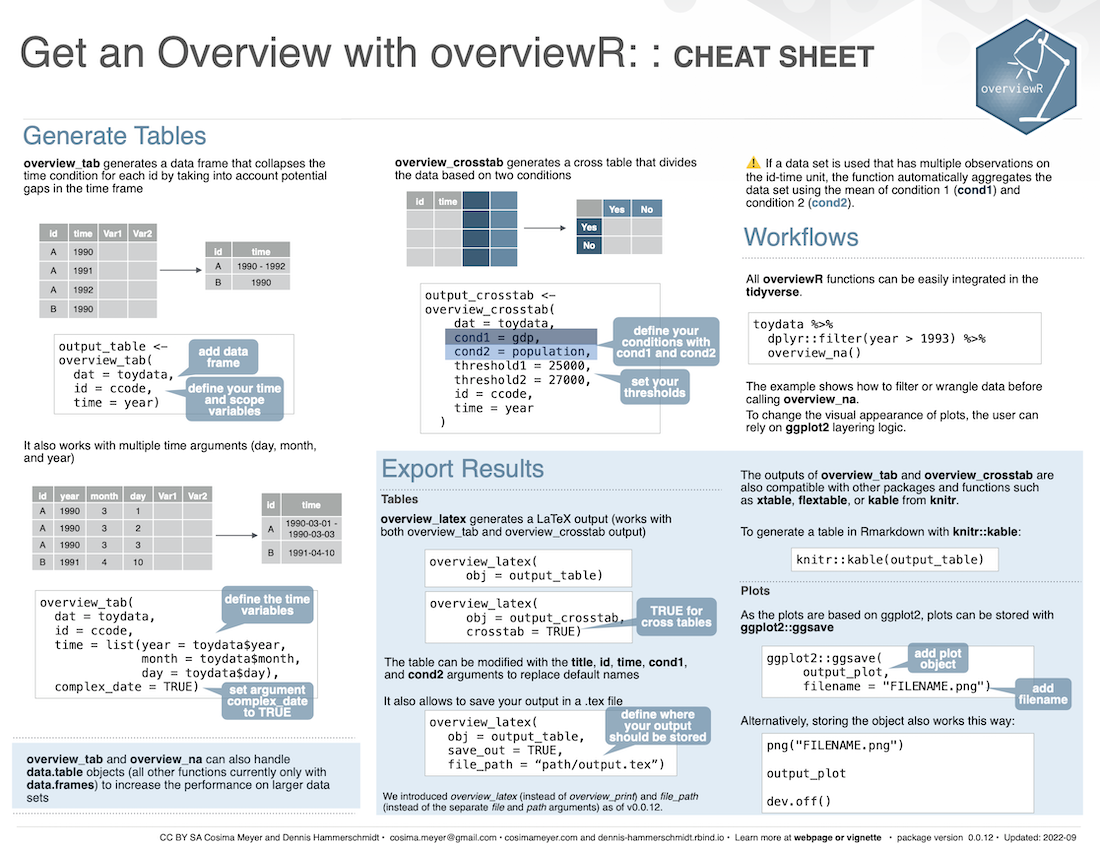 Display descriptive information about a data set, by Cosima Meyer and Dennis Hammerschmidt. Updated August 2020.
Parallel Computation
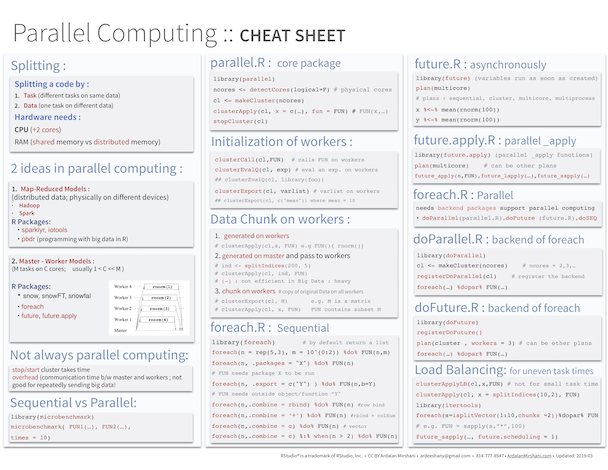 Parallel computing in R with the parallel, foreach, and future packages, by Ardalan Mirshani. Updated March 2019.
quanteda
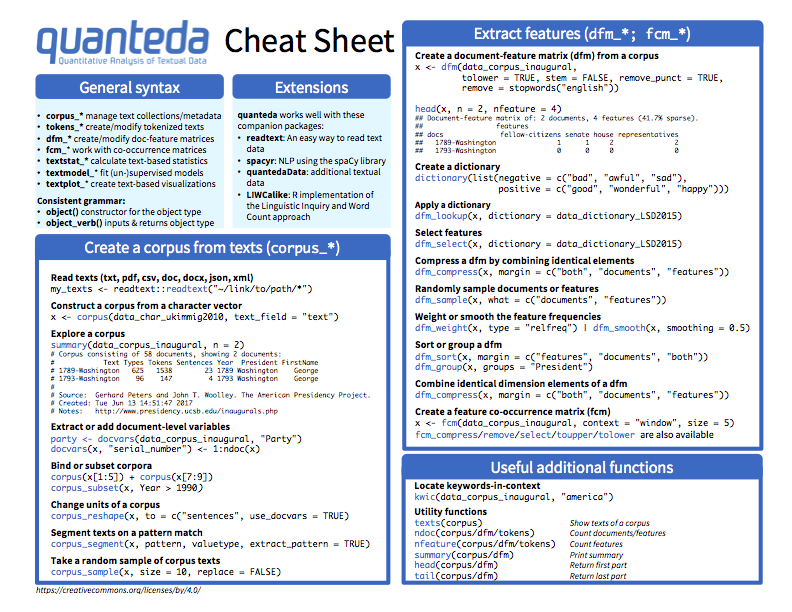 Quantitative Analysis of Textual Data in R with the quanteda package, by Stefan Müller and Kenneth Benoit. Updated May 2020.
randomizr
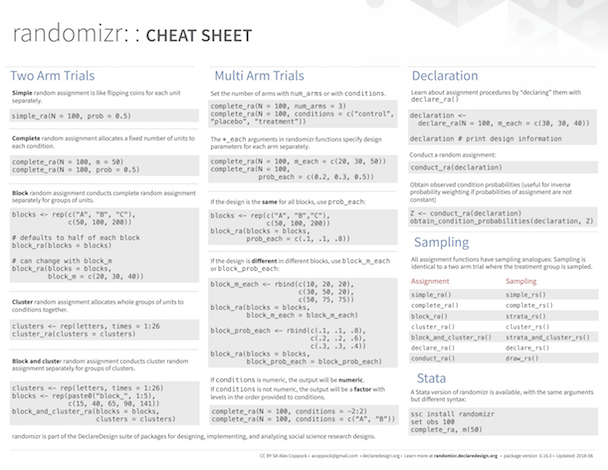 Automate random assignment and sampling with randomizr, by Alex Coppock. Updated June 2018.
Regular Expressions
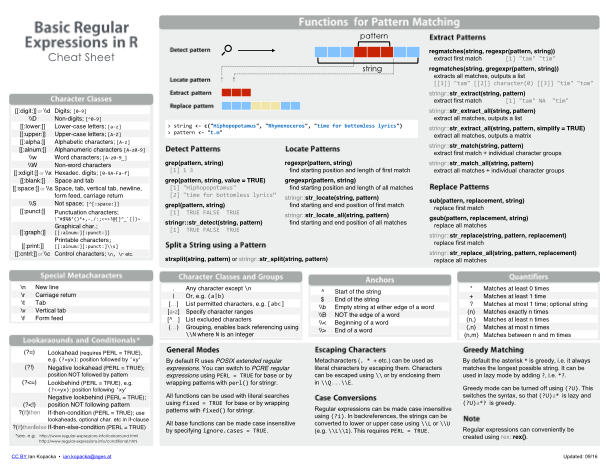 Basics of regular expressions and pattern matching in R, by Ian Kopacka. Updated July 2019.
SAS-R
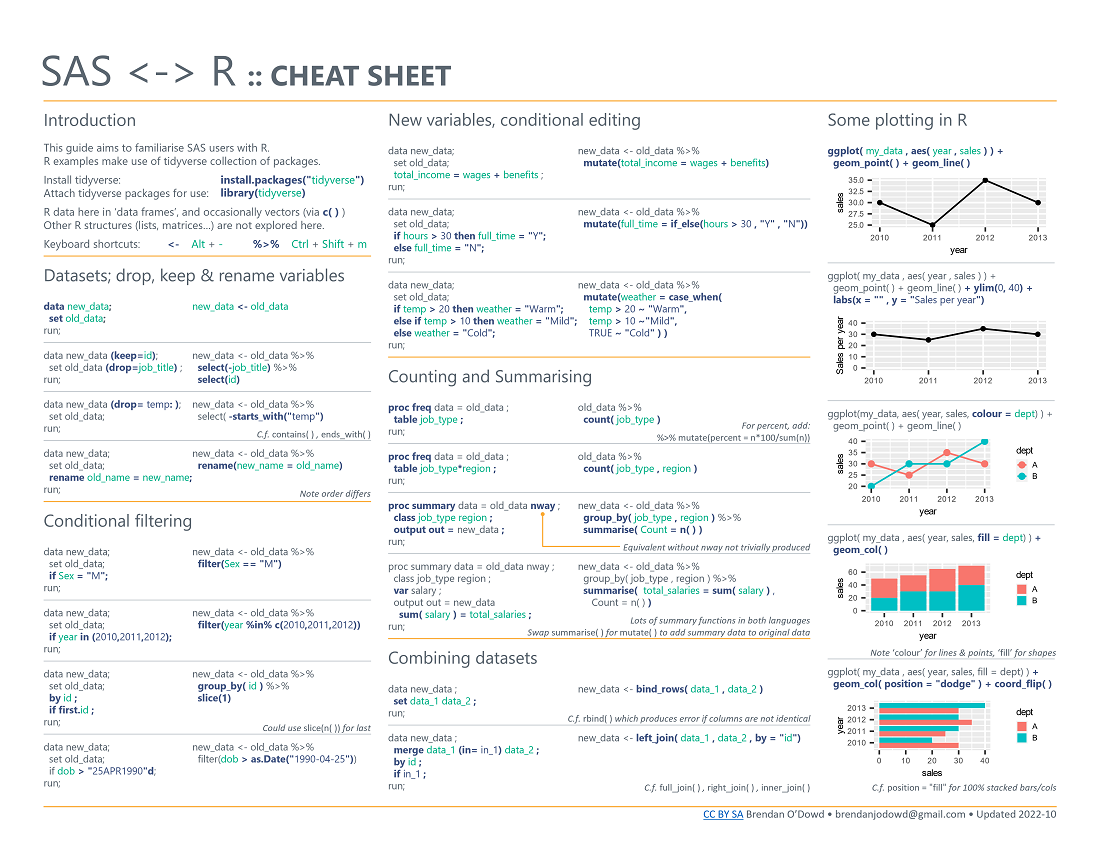 A guide to familiarise SAS users with R, and vice versa, by Brendan O’Dowd. Updated August 2021.
SamplingStrata
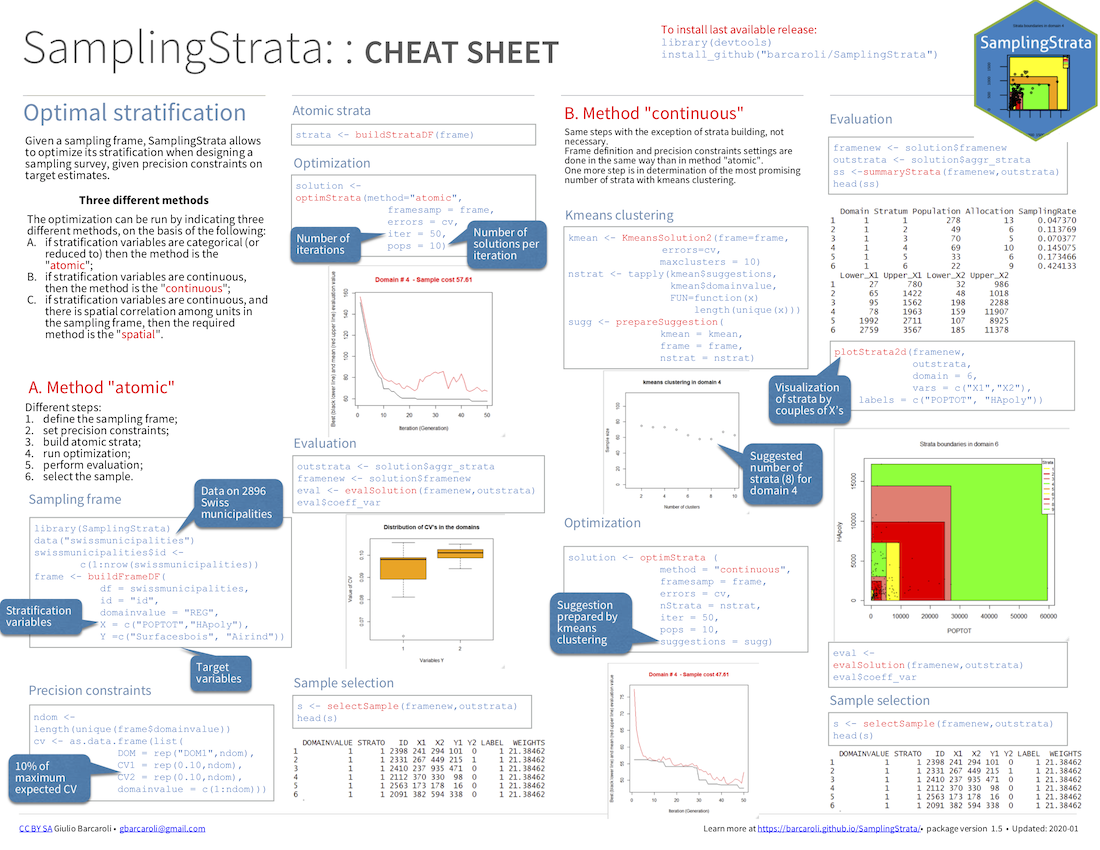 Optimal stratification for survey sampling, by Giulio Barcaroli. Updated January 2020.
Simple Features (sf)
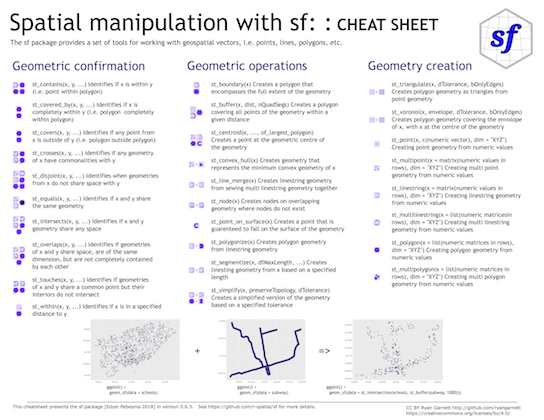 Tools for working with spatial vector data: points, lines, polygons, etc, by Ryan Garnett. Updated October 2018.
sjmisc
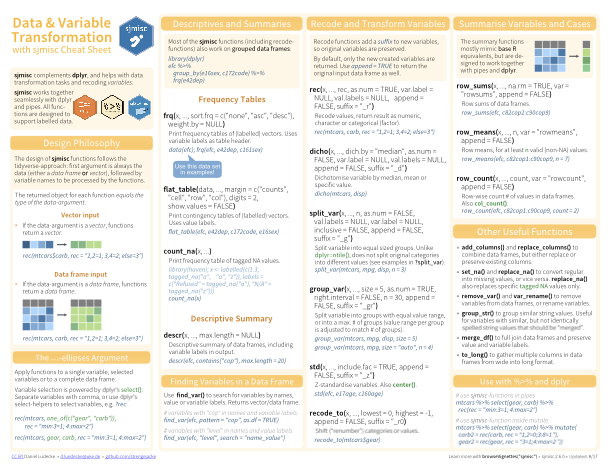 dplyr friendly data and variable transformation, by Daniel Lüdecke. Updated February 2018.
slackr
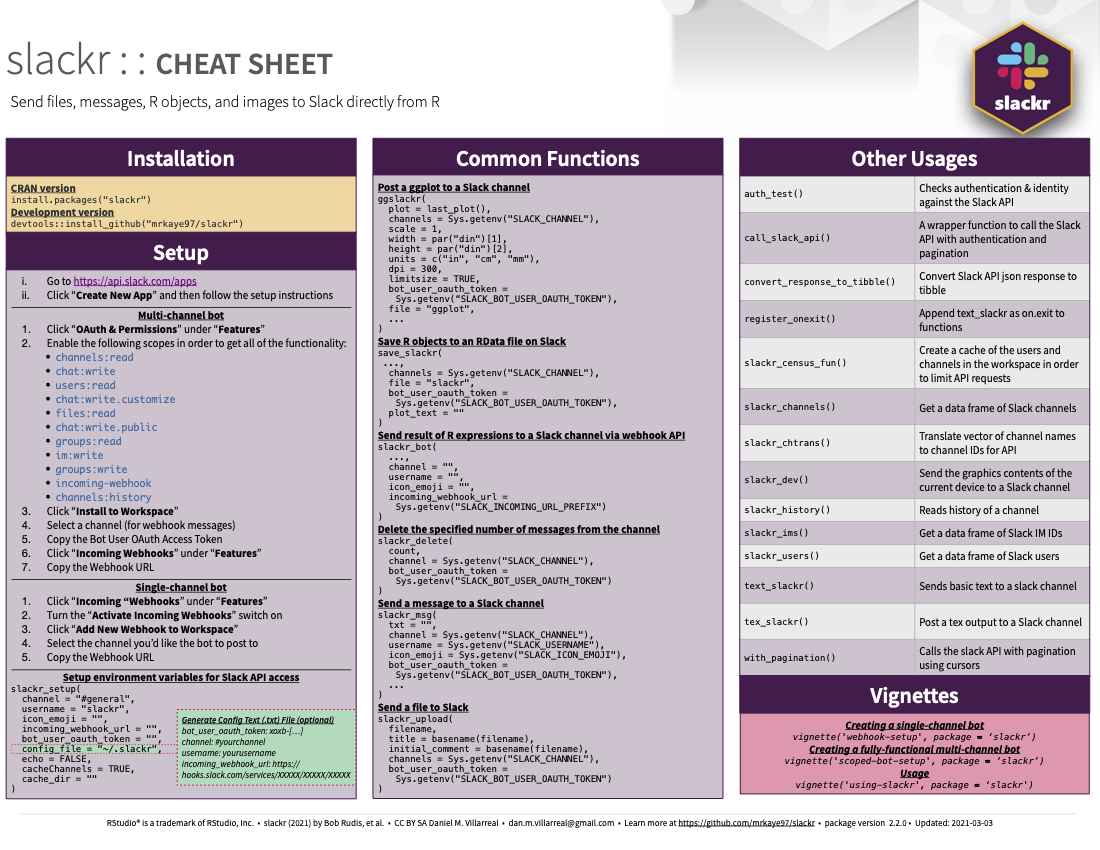 Send files, messages, R objects, and images to Slack directly from R, by Daniel M. Villarreal. Updated March 2021.
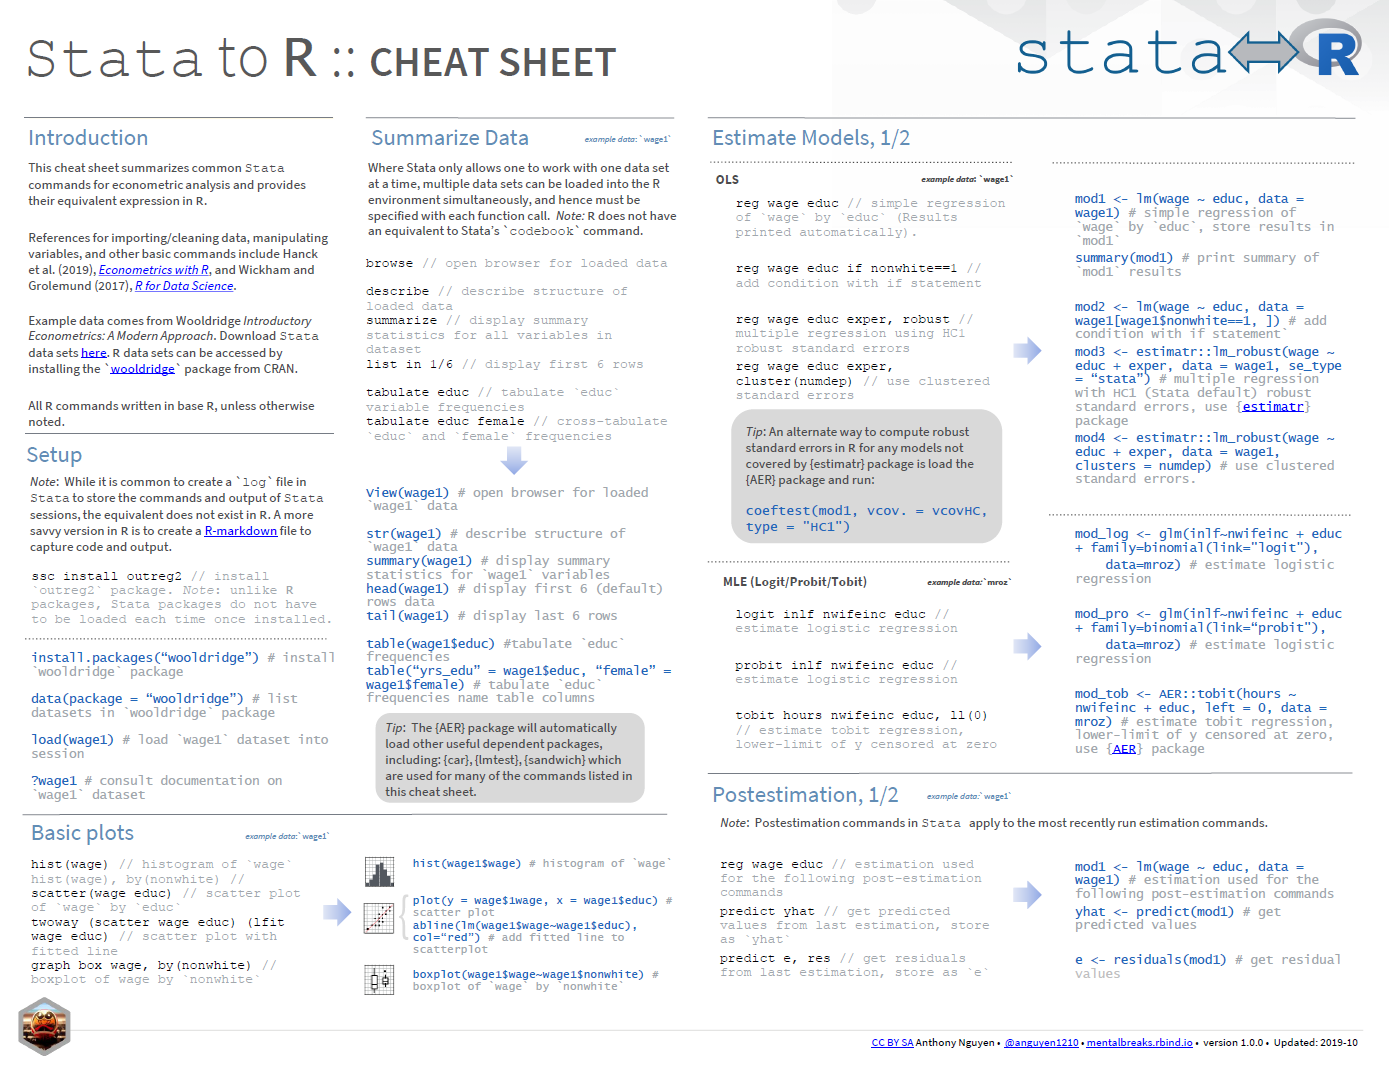
Syntax Comparison
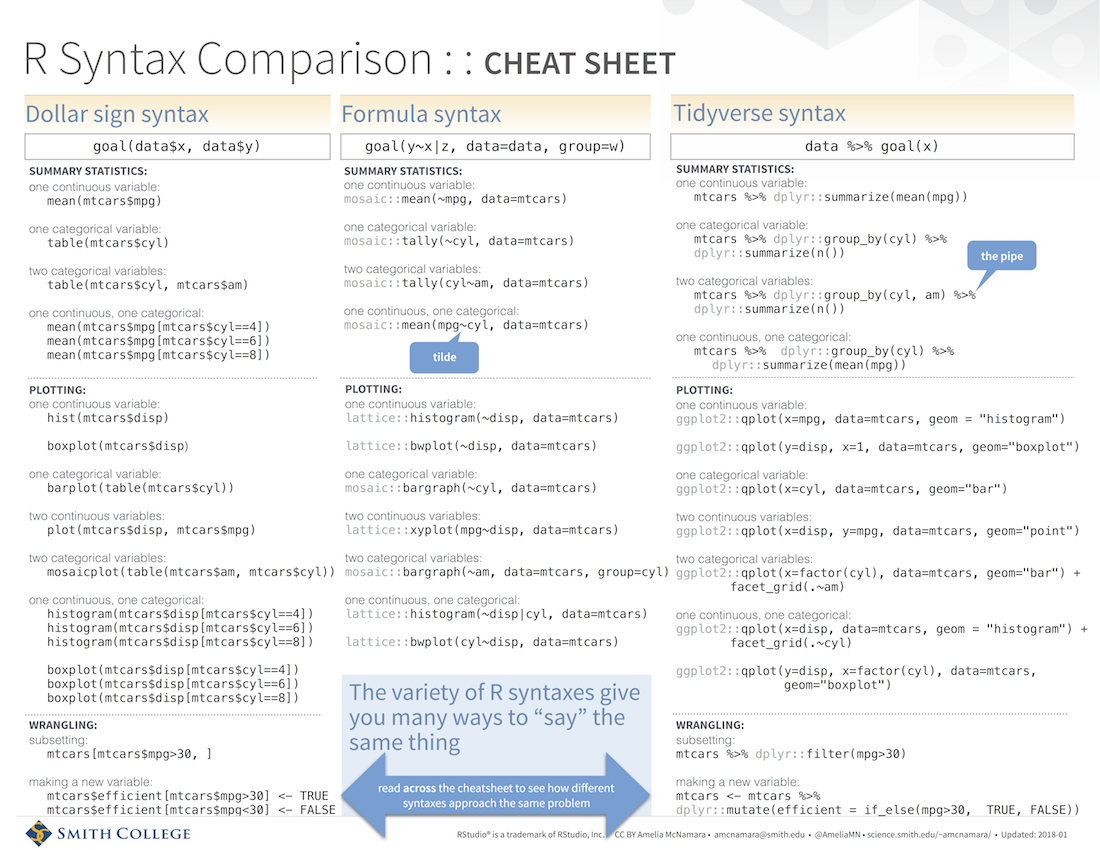 Three code styles compared: $, formula, and tidyverse, by Amelia McNamara. Updated January 2018.
Teach R
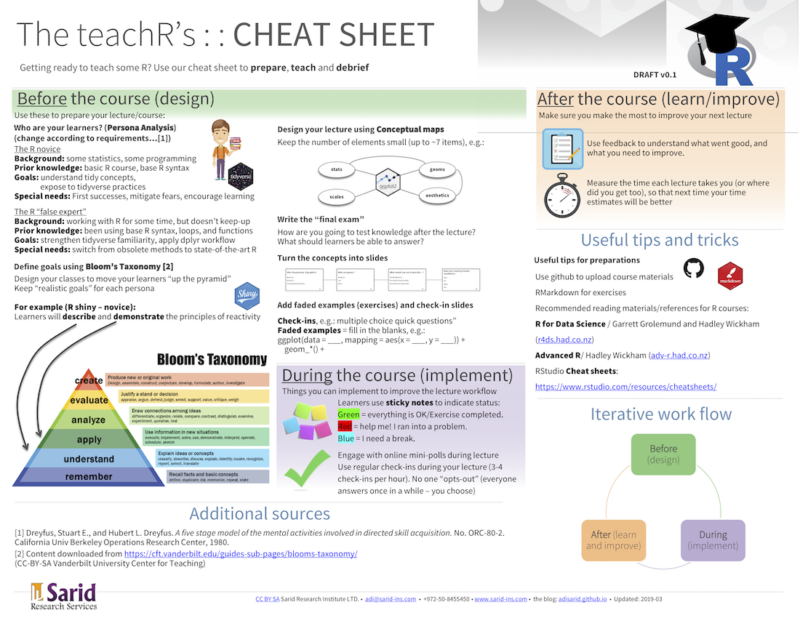 Concise advice on how to teach R or anything else, by Adi Sarid. Updated March 2019.
Time Series
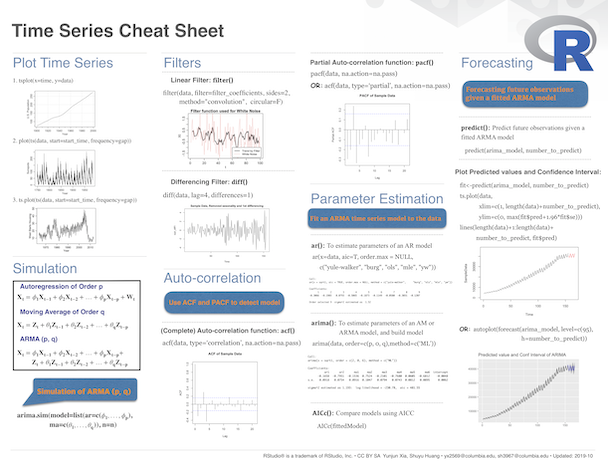 A reference to time series in R, by Yunjun Xia and Shuyu Huang. Updated October 2019.
tsbox
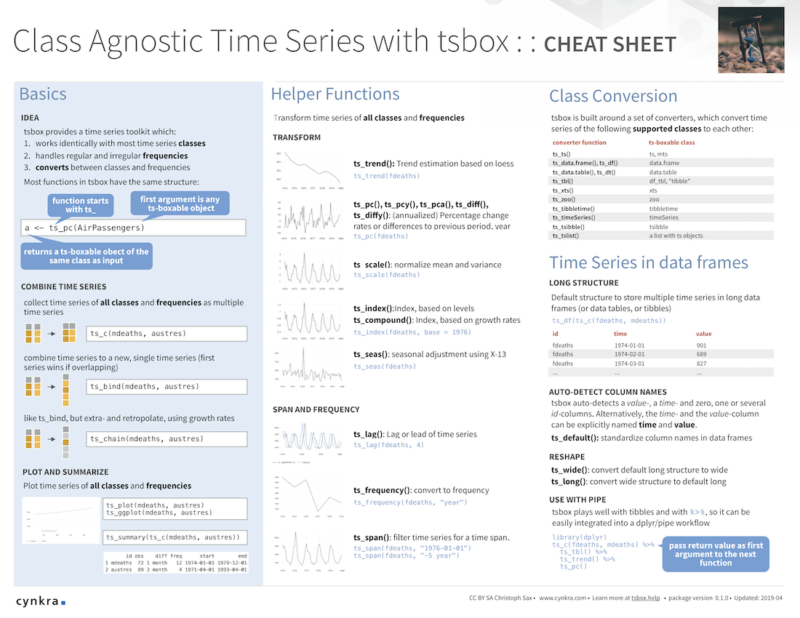 A time series toolkit for conversions, piping, and more, by Christoph Sax. Updated April 2019.
vtree
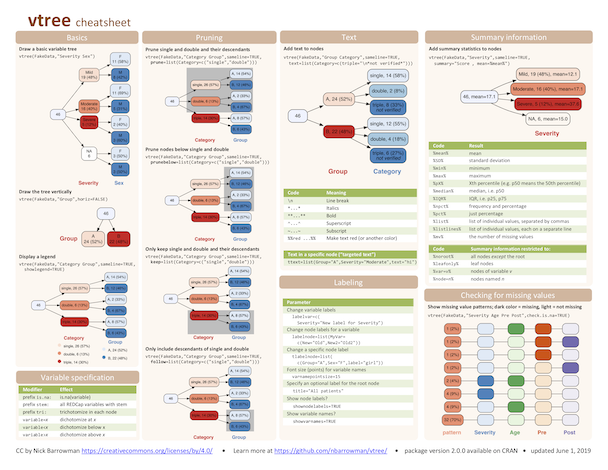 Visualize hierarchical subsets of data with variable trees, by Nick Barrowman. Updated July 2020.
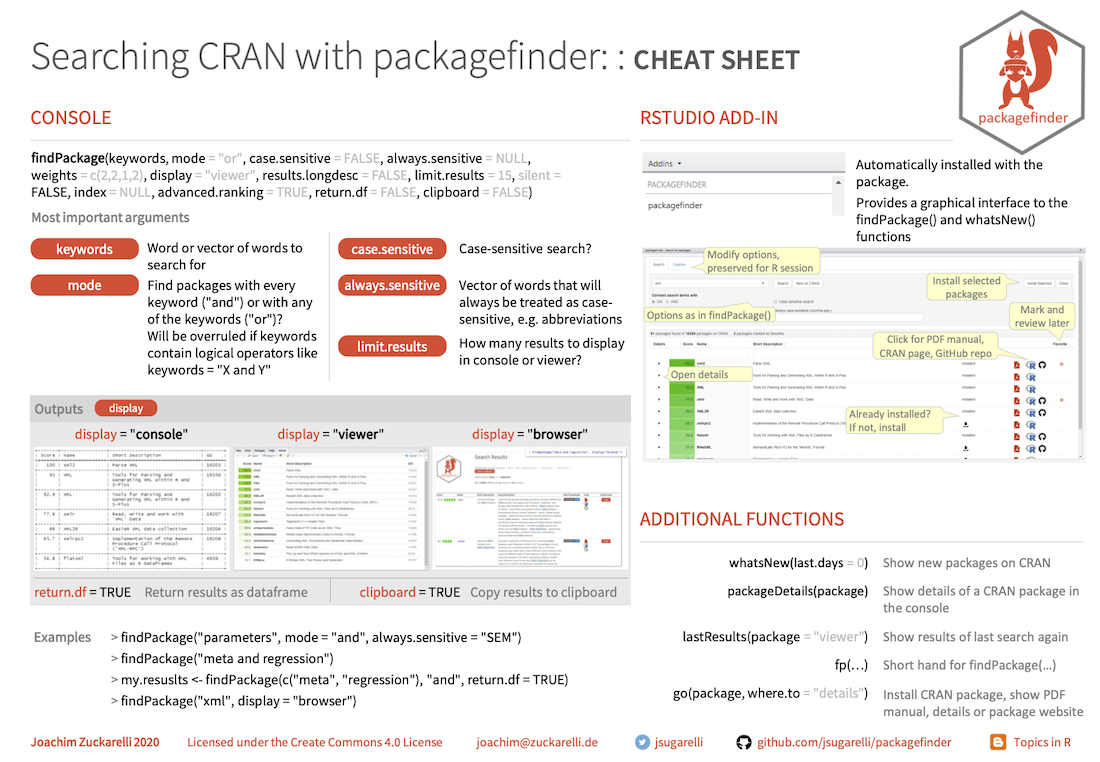
xplain
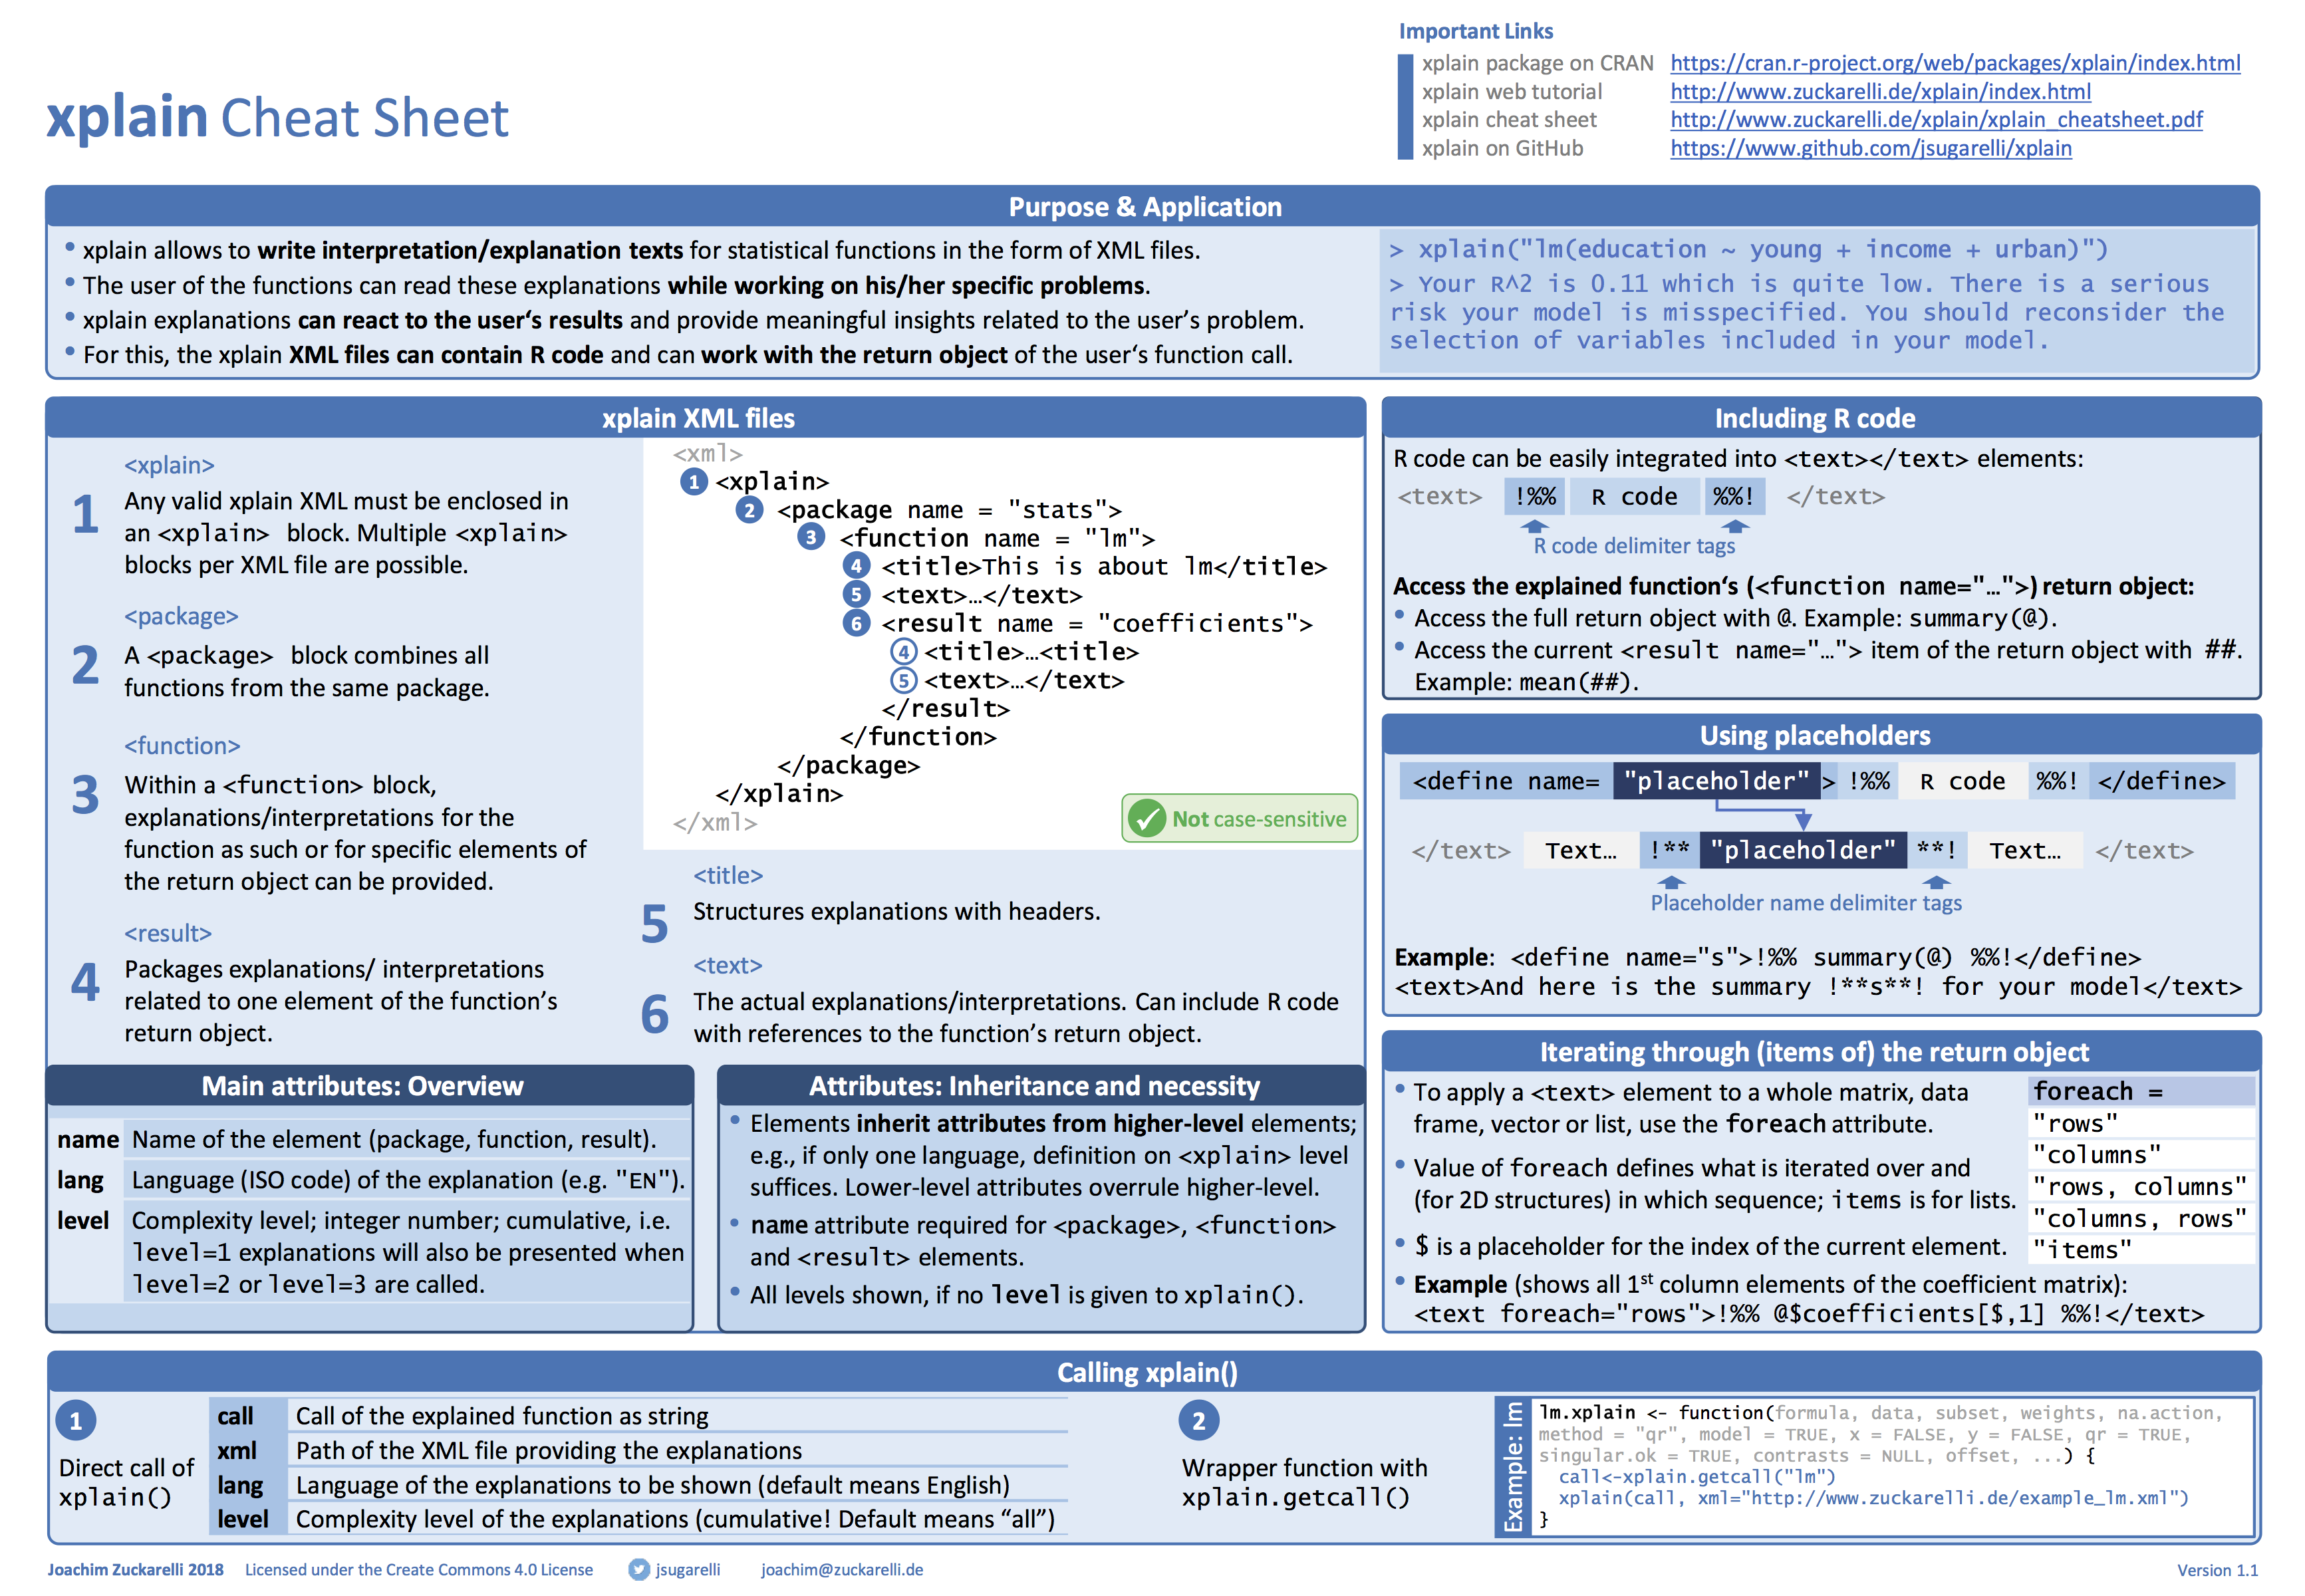 Explain statistical functions with XML files and xplain, by Joachim Zuckarelli. Updated May 2018.
Translations
Chinese Translations - 中文翻译
- Data science in Spark with sparklyr translated by Ke Zhang in Simplified Chinese and Traditional Chinese. Updated December 2016.
- Data transformation with dplyr translated by Aicen Yu in Simplified Chinese. Updated April 2019.
- Data visualization with ggplot2 translated by taoruicn. Updated August 2018.
- Deep learning with Keras translated by harryprince. Updated April 2019.
Dutch Translations - Nederlandse Vertaling
- Data visualization with ggplot2 translated by Gern Huijberts. Updated May 2018.
- Data wrangling translated by Gern Huijberts. Updated May 2018.
- Dynamic documents with rmarkdown translated by Gern Huijberts. Updated May 2018.
- Package development with devtools translated by Gern Huijberts. Updated May 2018.
French Translations - Traductions Françaises
- caret translated by Ahmadou Dicko. Updated September 2019.
- Data visualization with ggplot2 translated by Vincent Guyader and Diane Beldame of ThinkR. Updated May 2018.
- Data wrangling translated by Vincent Guyader and Diane Beldame of ThinkR. Updated May 2018.
- Interactive web apps with shiny translated by Vincent Guyader and Diane Beldame of ThinkR. May 2018.
- quanteda translated by Ahmadou Dicko. Updated September 2019.
- Regular expressions translated by Ahmadou Dicko. Updated August 2019.
- RStudio IDE translated by Vincent Guyader and Diane Beldame of ThinkR. Updated May 2018.
German Translations - Deutsch Übersetzungen
- Base R translated by Annika Kies and Martin Kies from LeverageData. Updated April 2020.
- Data science in Spark with sparklyr translated by Ke Zhang. Updated March 2017.
- Data transformation with dplyr translated by Lucia Gjeltema of Research Triangle Analysts. Updated September 2017.
- Data visualization with ggplot2 translated by Lucia Gjeltema of Research Triangle Analysts. Updated May 2018.
- Dynamic documents with rmarkdown translated by Lucia Gjeltema of Research Triangle Analysts. Updated May 2018.
- Interactive web apps with shiny translated by Lucia Gjeltema of Research Triangle Analysts. Updated May 2018.
- Package development with devtools translated by Lucia Gjeltema of Research Triangle Analysts. Updated May 2018.
Greek Translations - Ελληνικές μεταφράσεις
- Base R translated by Kleanthis Koupidis, Charalampos Bratsas, and Open Knowledge Greece. Updated June 2018.
- RStudio IDE translated by Kleanthis Koupidis, Charalampos Bratsas, and Open Knowledge Greece. Updated June 2018.
Italian Translations - Traduzioni Italiane
- Dynamic documents with rmarkdown translated by Angelo Salatino of Knowledge Media Institute. Updated June 2018.
- Package development with devtools translated by Angelo Salatino of Knowledge Media Institute. Updated June 2018.
- RStudio IDE translated by Angelo Salatino of Knowledge Media Institute. Updated June 2018.
Japanese Translations - 日本語翻訳
- Base R translated by Takeshi Sasayama. Updated June 2018.
- Data science in Spark with sparklyr translated by Masato Takahashi. Updated March 2018.
- Data visualization with ggplot2 translated by Takeshi Sasayama. Updated May 2018.
- Data wrangling translated by Tomoaki Masuda of the MIT Sloan Data Analytics Club. Updated May 2018.
- Deep learning with Keras translated by Masato Takahashi. Updated March 2018.
- Dynamic documents with rmarkdown translated by Masato Takahashi. Updated March 2018.
- Factors with forcats translated by Taiyo Nakashima. Updated March 2019.
- RStudio IDE translated by Masato Takahashi. Updated March 2018.
Korean Translations - 한국어 로 번역
- Apply functions with purrr translated by Victor Lee of xwMOOC. Updated November 2017.
- caret translated by Victor Lee of xwMOOC. Updated September 2017.
- Dynamic documents with rmarkdown translated by Victor Lee of xwMOOC. Updated May 2018.
- Package development with devtools translated by Victor Lee of xwMOOC. Updated May 2018.
- Syntax comparison translated by Victor Lee of xwMOOC. Updated February 2018.
Persian Translations - ترجمه های فارسی
- Data import translated by Vahid Faraji Jobehar and Reza Mazloomi. Updated March 2019.
Portuguese Translations - tradução para português
- Base R translated by Samuel Carleial. Updated August 2020.
- caret translated by Karen da Silva Lopes. Updated April 2020.
- Data visualization with ggplot2 translated by Augusto Queiroz de Macedo. Updated May 2018.
- Data wrangling translated by Augusto Queiroz de Macedo. Updated May 2018.
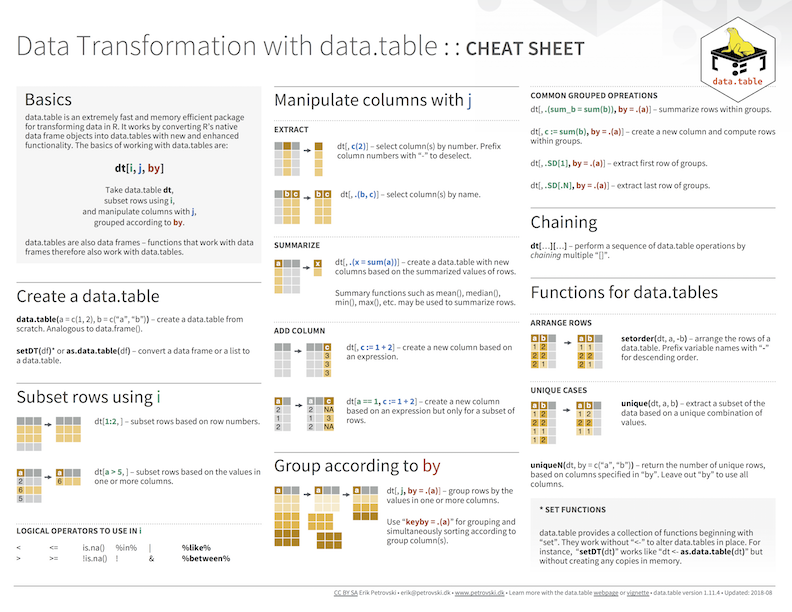
- data.table translated by Samuel Carleial. Updated August 2020.
- RStudio IDE translated by Augusto Queiroz de Macedo. Updated May 2018.
Russian Translations - Переводы
- Apply functions with purrr translated by Evgeni Chasnovski of QuestionFlow. Updated January 2018.
- Data import translated by Evgeni Chasnovski of QuestionFlow. Updated February 2018.
- Data transformation with dplyr translated by Evgeni Chasnovski of QuestionFlow. Updated January 2018.
- Dates and times with lubridate translated by Evgeni Chasnovski of QuestionFlow. Updated March 2018.
Spanish Translations - Traducciones en español
- Apply functions with purrr translated by Carlos Ortega of the Grupo de Usuarios de R de Madrid. Updated October 2017.
- caret translated by Carlos Ortega of the Grupo de Usuarios de R de Madrid. Updated September 2017.
- Data import translated by Yanina Bellini Saibene. Updated December 2019.
- Data science in Spark with sparklyr translated by DaniPrina. Updated December 2019.
- Data transformation with dplyr translated by Frans van Dunné of ixpantia. Updated March 2018.
- Data visualization with ggplot2 translated by Carolina Mengoni Goñalons. Updated December 2019.
- Dates and times with lubridate translated by Yanina Bellini Saibene. Updated December 2019.
- Deep learning with Keras translated by Carlos Ortega of the Grupo de Usuarios de R de Madrid. Updated January 2018.
- Dynamic documents with rmarkdown translated by Jessica Formoso. Updated January 2020.
- Entorno de desarrollo RStudio translated by Monica Alonso. Updated December 2019.
- Estadística descriptiva con R translated by Rosana Ferraro of Máxima Formación. Updated June 2018.
- Factors with forcats translated by Laura Acion. Updated January 2020.
- Interactive web apps with shiny translated by Frans van Dunné of ixpantia. Updated May 2018.
- Introducción a R translated by Rosana Ferraro of Máxima Formación. Updated June 2018.
- Package development with devtools translated by Paola Corrales. Updated December 2019.
- Python with R and reticulate translated by Vanesa Maribel. Updated January 2020.
- String manipulation with stringr translated by Carlos Ortega of the Grupo de Usuarios de R de Madrid (updated by L. Paloma Rojas Saunero). Updated December 2019.
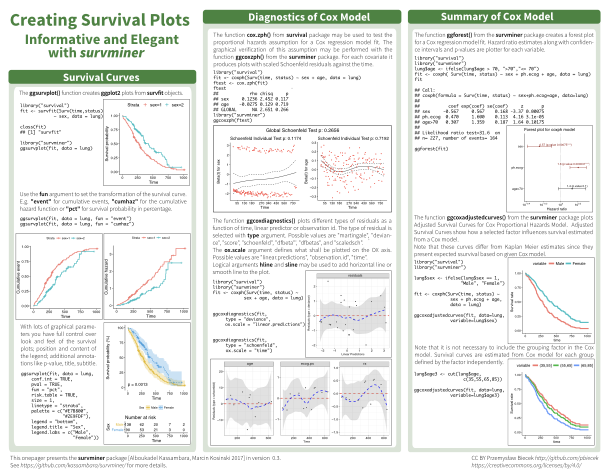
- survminer translated by Maria Dermit. Updated March 2021.
- Syntax comparison translated by Riva Quiroga. Updated June 2020.
Turkish Translations - Türkçe Çeviriler
- Base R translated by Elif Kartal. Updated January 2018.
- caret translated by İlkim Ecem Emre. Updated January 2018.
- Data import translated by Metin Yazici. Updated October 2017.
- Data transformation with dplyr translated by Hazel kavılı and Berk Orbay. Updated February 2018.
- Data visualization with ggplot2 translated by Hazel kavılı and Berk Orbay. Updated January 2018.
- Dynamic documents with rmarkdown translated by Metin Yazici. Updated February 2018.
- Interactive web apps with shiny translated by Metin Yazici. Updated October 2017.
- Regular expressions translated by Zeki Özen. Updated January 2018.
Ukrainian Translations - українські переклади
- Apply functions with purrr translated by Evgeni Chasnovski of QuestionFlow. Updated March 2018.
- Data import translated by Evgeni Chasnovski of QuestionFlow. Updated February 2018.
- Data transformation with dplyr translated by Evgeni Chasnovski of QuestionFlow. Updated January 2018.
- Dates and times with lubridate translated by Evgeni Chasnovski of QuestionFlow. Updated January 2018.
Uzbek Translations - O‘zbek tilidagi tarjimalar
- Data import translated by Alisher Suyunov. Updated August 2017.
- Data transformation with dplyr translated by Alisher Suyunov. Updated August 2017.
Vietnamese Translations - Bản dịch tiếng Việt
- Apply functions with purrr translated by Anh Hoang Duc and Duc Pham of RAnalytics.vn. Updated July 2018.
- Base R translated by Anh Hoang Duc and Duc Pham of RAnalytics.vn. Updated May 2018.
- Data visualization with ggplot2 translated by Anh Hoang Duc and Duc Pham of RAnalytics.vn. Updated May 2018.
- Data wrangling translated by Anh Hoang Duc and Duc Pham of RAnalytics.vn. Updated May 2018.
- Dates and times with lubridate translated by Anh Hoang Duc and Duc Pham of RAnalytics.vn. Updated July 2018.
- Dynamic documents with rmarkdown translated by Anh Hoang Duc and Duc Pham of RAnalytics.vn. Updated May 2018.
- Interactive web apps with shiny translated by Anh Hoang Duc and Duc Pham of RAnalytics.vn. Updated May 2018.
- Package development with devtools translated by Anh Hoang Duc and Duc Pham of RAnalytics.vn. Updated May 2018.
- String manipulation with stringr translated by Anh Hoang Duc and Duc Pham of RAnalytics.vn. Updated July 2018.
Previous versions
To see version histories of the cheatsheets and translations, visit the Cheatsheet GitHub Repository.
Want to contribute?
We accept high-quality cheatsheets and translations that are licensed under the Creative Commons CC BY 4.0 license. Details and templates are available at How to Contribute a Cheatsheet.